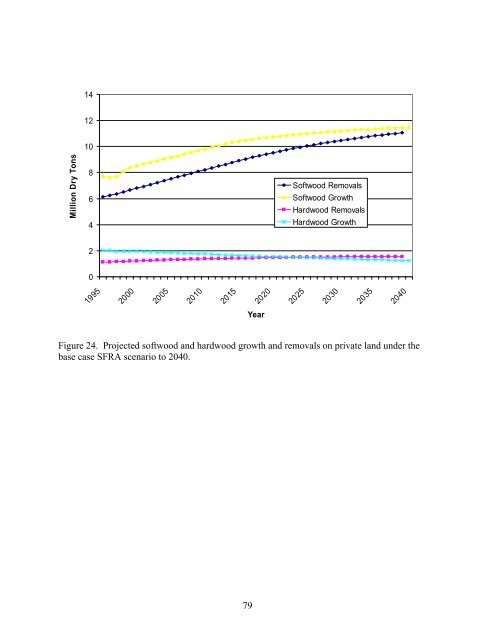
1412Million Dry Tons10864Softwood RemovalsSoftwood GrowthHardwood RemovalsHardwood Growth201995200020052010201520202025203020352040YearFigure 24. Projected softwood and hardwood growth and removals on private land under thebase case SFRA scenario to 2040.79
3.3. RESULTS3.3.1. GRUTable 27. Results for the base case projection to 2040 for the GRU Deerhaven facility.Cumulative<strong>Resource</strong>/haul time categoryDry tonsrecoverableTBtu/yearRecoverableTBtu/yearrecoverablePrice($/MMBtu)Urban wood, 0-15 min. 3,067 0.05 0.05 0.62Urban wood, 15-30 min. 13,026 0.19 0.24 0.81Urban wood, 30-45 min. 17,255 0.26 0.50 0.99Urban wood, 45-60 min. 16,350 0.24 0.74 1.18Urban wood, 60-75 min. 16,846 0.25 0.99 1.36Urban wood, 75-90 min. 20,491 0.31 1.30 1.55Urban wood, 90-105 min. 25,458 0.38 1.68 1.73Urban wood, 105-120 min. 34,048 0.51 2.19 1.92Logging residues, 0-15 min. 6,805 0.11 2.29 2.60Longleaf restoration, 0-15 min. 552 0.01 2.30 2.71Logging residues, 15-30 min. 34,704 0.54 2.84 2.77Longleaf restoration, 15-30 min. 3,166 0.05 2.89 2.89Logging residues, 30-45 min. 69,801 1.09 3.98 2.94Longleaf restoration, 30-45 min. 12,567 0.19 4.17 3.07Logging residues, 45-60 min. 70,577 1.10 5.27 3.12Longleaf restoration, 45-60 min. 20,690 0.31 5.58 3.25Logging residues, 60-75 min. 78,783 1.23 6.80 3.29Longleaf restoration, 60-75 min. 18,472 0.28 7.08 3.43Logging residues, 75-90 min. 98,913 1.54 8.62 3.46Longleaf restoration, 75-90 min. 23,188 0.35 8.97 3.60Logging residues, 90-105 min. 95,664 1.49 10.46 3.64Pulpwood, 0-15 min. 28,363 0.46 10.92 3.72Longleaf restoration, 90-105 min. 28,733 0.43 11.35 3.78Logging residues, 105-120 min. 57,858 0.90 12.25 3.81Pulpwood, 15-30 min. 150,515 2.43 14.68 3.88Longleaf restoration, 105-120 min. 27,653 0.41 15.10 3.96Pulpwood, 30-45 min. 320,862 5.18 20.28 4.04Pulpwood, 45-60 min. 339,864 5.49 25.77 4.20Pulpwood, 60-75 min. 365,944 5.91 31.68 4.35Pulpwood, 75-90 min. 463,563 7.49 39.17 4.51Pulpwood, 90-105 min. 407,265 6.58 45.75 4.67Pulpwood, 105-120 min. 219,575 3.55 49.30 4.8380
- Page 3 and 4:
ACKNOWLEDGEMENTSThe authors acknowl
- Page 5 and 6:
4.2. Scenario A: Delivered to remot
- Page 7:
Figure 22. Projected softwood and h
- Page 10 and 11:
LIST OF ACRONYMS AND ABBREVIATIONSB
- Page 12 and 13:
1. INTRODUCTION1.1. Project Backgro
- Page 14 and 15:
Task-3: Transportation. Transportat
- Page 16 and 17:
2. TASK 1: WOODSHED DELINEATION AND
- Page 18 and 19:
calculations for urban wood waste a
- Page 20 and 21:
the current pulpwood harvests are a
- Page 22 and 23:
2,0001,800Acres (thousands)1,6001,4
- Page 24 and 25:
ton -1 ($17.38 green ton -1 ) for t
- Page 26 and 27:
$ per million BTU, delivered$4.00$3
- Page 28 and 29:
10.65 TBtu/year required to meet de
- Page 30 and 31:
haul time category in each county,
- Page 32 and 33: Figure 9. TAL Hopkins two-hour one-
- Page 34 and 35: Figure 11. GRU, JEA, and TAL woodsh
- Page 36 and 37: Dry tonsrecoverableTBtu/yearRecover
- Page 38 and 39: Dry tonsrecoverableTBtu/yearrecover
- Page 40 and 41: Table 6. Results for scenario #3,
- Page 42 and 43: Table 7. Results for scenario #4,
- Page 44 and 45: Table 9. Results for scenario #6,
- Page 46 and 47: 6.005.004.00$/MMBtu3.002.001.001: W
- Page 48 and 49: Resource/haul time categoryDry tons
- Page 50 and 51: Resource/haul time categoryDry tons
- Page 52 and 53: Table 12. Results for scenario #3,
- Page 54 and 55: Table 13. Results for scenario #4,
- Page 56 and 57: Table 15. Results for scenario #6,
- Page 58 and 59: 6.005.004.00$/MMBtu3.002.001.001: W
- Page 60 and 61: Resource/haul time categoryDry tons
- Page 62 and 63: Resource/haul time categoryDry tons
- Page 64 and 65: Table 18. Results for scenario #3,
- Page 66: Table 19. Results for scenario #4,
- Page 69 and 70: Resource/haul time categoryDry tons
- Page 71 and 72: 2.4.4. General resultsIt is difficu
- Page 73 and 74: Table 22. Yield, acreage required,
- Page 75 and 76: Table 25. Capital construction outp
- Page 77 and 78: 3. TASK 2: SUSTAINABILITY IMPACTS F
- Page 79 and 80: under this scenario are expected to
- Page 81: acres in 1995 to 8.5 MM acres in 20
- Page 85 and 86: 5.004.504.003.50$/MMBtu3.002.502.00
- Page 87 and 88: Table 30. Results for the conservat
- Page 89 and 90: 3.3.3. TAL Hopkins facilityTable 31
- Page 91 and 92: 5.004.504.003.50$/MMBtu3.002.502.00
- Page 93 and 94: For GRU most of these do not apply;
- Page 95 and 96: Table 33. Concentration yard costs.
- Page 97 and 98: location of the rail siding and the
- Page 99 and 100: discussed, to get an idea of the pr
- Page 101 and 102: 5. TASK 4: CO 2 EMISSIONS FROM HARV
- Page 103 and 104: in fuel chips and the carbon in fue
- Page 105 and 106: transporting coal. However, because
- Page 107 and 108: 6. COMBINED RESOURCE AVAILABILITYPa
- Page 109 and 110: Resource/haul time categoryTBtu/yea
- Page 111 and 112: Table 39. Combined resources (resou
- Page 113 and 114: Resource/haul time categoryTBtu/yea
- Page 115 and 116: Resource/haul time categoryTBtu/yea
- Page 117 and 118: Resource/haul time categoryTBtu/yea
- Page 119 and 120: OverstockedNatural Stands,0.16, 1%
- Page 121 and 122: logging residues from 90% to 60% to
- Page 123 and 124: ecommend that GRU, in coordination
- Page 125: 9. REFERENCESBlack and Veach (2004)