Biomass Resource Assessment Part I - Gainesville Regional Utilities
Biomass Resource Assessment Part I - Gainesville Regional Utilities
Biomass Resource Assessment Part I - Gainesville Regional Utilities

Create successful ePaper yourself
Turn your PDF publications into a flip-book with our unique Google optimized e-Paper software.
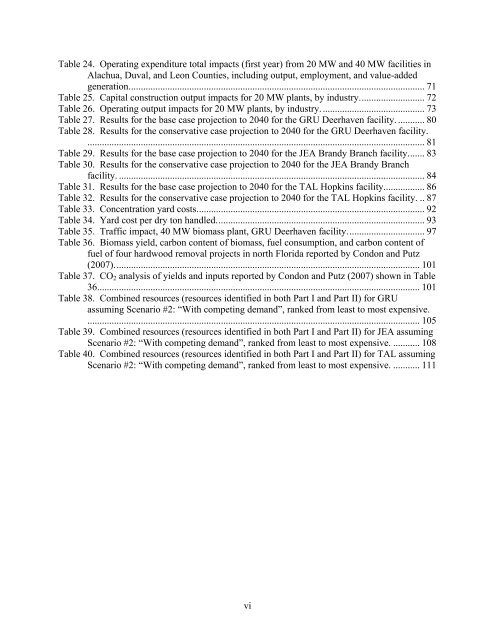
Table 24. Operating expenditure total impacts (first year) from 20 MW and 40 MW facilities inAlachua, Duval, and Leon Counties, including output, employment, and value-addedgeneration. ......................................................................................................................... 71Table 25. Capital construction output impacts for 20 MW plants, by industry. .......................... 72Table 26. Operating output impacts for 20 MW plants, by industry. .......................................... 73Table 27. Results for the base case projection to 2040 for the GRU Deerhaven facility. ........... 80Table 28. Results for the conservative case projection to 2040 for the GRU Deerhaven facility............................................................................................................................................ 81Table 29. Results for the base case projection to 2040 for the JEA Brandy Branch facility. ...... 83Table 30. Results for the conservative case projection to 2040 for the JEA Brandy Branchfacility. .............................................................................................................................. 84Table 31. Results for the base case projection to 2040 for the TAL Hopkins facility. ................ 86Table 32. Results for the conservative case projection to 2040 for the TAL Hopkins facility. .. 87Table 33. Concentration yard costs. ............................................................................................. 92Table 34. Yard cost per dry ton handled. ..................................................................................... 93Table 35. Traffic impact, 40 MW biomass plant, GRU Deerhaven facility. ............................... 97Table 36. <strong>Biomass</strong> yield, carbon content of biomass, fuel consumption, and carbon content offuel of four hardwood removal projects in north Florida reported by Condon and Putz(2007). ............................................................................................................................. 101Table 37. CO 2 analysis of yields and inputs reported by Condon and Putz (2007) shown in Table36..................................................................................................................................... 101Table 38. Combined resources (resources identified in both <strong>Part</strong> I and <strong>Part</strong> II) for GRUassuming Scenario #2: “With competing demand”, ranked from least to most expensive.......................................................................................................................................... 105Table 39. Combined resources (resources identified in both <strong>Part</strong> I and <strong>Part</strong> II) for JEA assumingScenario #2: “With competing demand”, ranked from least to most expensive. ........... 108Table 40. Combined resources (resources identified in both <strong>Part</strong> I and <strong>Part</strong> II) for TAL assumingScenario #2: “With competing demand”, ranked from least to most expensive. ........... 111vi