Biomass Resource Assessment Part I - Gainesville Regional Utilities
Biomass Resource Assessment Part I - Gainesville Regional Utilities
Biomass Resource Assessment Part I - Gainesville Regional Utilities

Create successful ePaper yourself
Turn your PDF publications into a flip-book with our unique Google optimized e-Paper software.
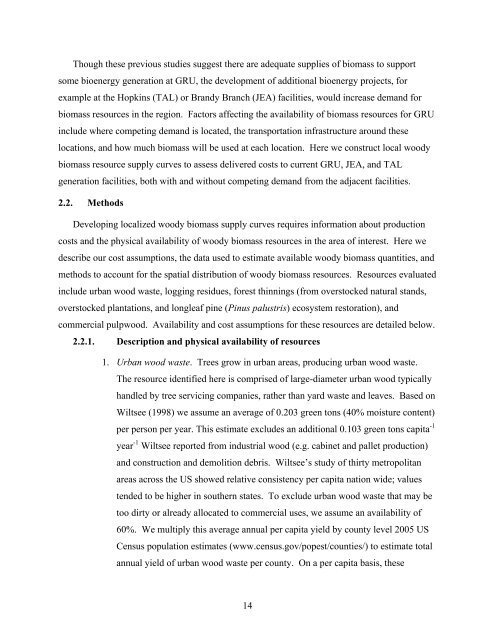
Though these previous studies suggest there are adequate supplies of biomass to supportsome bioenergy generation at GRU, the development of additional bioenergy projects, forexample at the Hopkins (TAL) or Brandy Branch (JEA) facilities, would increase demand forbiomass resources in the region. Factors affecting the availability of biomass resources for GRUinclude where competing demand is located, the transportation infrastructure around theselocations, and how much biomass will be used at each location. Here we construct local woodybiomass resource supply curves to assess delivered costs to current GRU, JEA, and TALgeneration facilities, both with and without competing demand from the adjacent facilities.2.2. MethodsDeveloping localized woody biomass supply curves requires information about productioncosts and the physical availability of woody biomass resources in the area of interest. Here wedescribe our cost assumptions, the data used to estimate available woody biomass quantities, andmethods to account for the spatial distribution of woody biomass resources. <strong>Resource</strong>s evaluatedinclude urban wood waste, logging residues, forest thinnings (from overstocked natural stands,overstocked plantations, and longleaf pine (Pinus palustris) ecosystem restoration), andcommercial pulpwood. Availability and cost assumptions for these resources are detailed below.2.2.1. Description and physical availability of resources1. Urban wood waste. Trees grow in urban areas, producing urban wood waste.The resource identified here is comprised of large-diameter urban wood typicallyhandled by tree servicing companies, rather than yard waste and leaves. Based onWiltsee (1998) we assume an average of 0.203 green tons (40% moisture content)per person per year. This estimate excludes an additional 0.103 green tons capita -1year -1 Wiltsee reported from industrial wood (e.g. cabinet and pallet production)and construction and demolition debris. Wiltsee’s study of thirty metropolitanareas across the US showed relative consistency per capita nation wide; valuestended to be higher in southern states. To exclude urban wood waste that may betoo dirty or already allocated to commercial uses, we assume an availability of60%. We multiply this average annual per capita yield by county level 2005 USCensus population estimates (www.census.gov/popest/counties/) to estimate totalannual yield of urban wood waste per county. On a per capita basis, these14