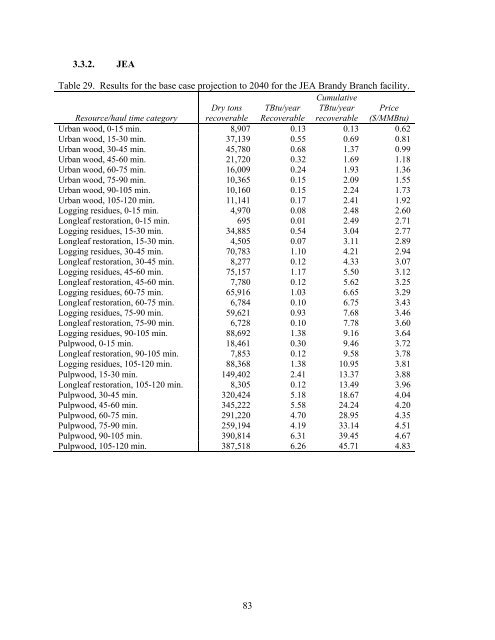
3.3.2. JEATable 29. Results for the base case projection to 2040 for the JEA Brandy Branch facility.Cumulative<strong>Resource</strong>/haul time categoryDry tonsrecoverableTBtu/yearRecoverableTBtu/yearrecoverablePrice($/MMBtu)Urban wood, 0-15 min. 8,907 0.13 0.13 0.62Urban wood, 15-30 min. 37,139 0.55 0.69 0.81Urban wood, 30-45 min. 45,780 0.68 1.37 0.99Urban wood, 45-60 min. 21,720 0.32 1.69 1.18Urban wood, 60-75 min. 16,009 0.24 1.93 1.36Urban wood, 75-90 min. 10,365 0.15 2.09 1.55Urban wood, 90-105 min. 10,160 0.15 2.24 1.73Urban wood, 105-120 min. 11,141 0.17 2.41 1.92Logging residues, 0-15 min. 4,970 0.08 2.48 2.60Longleaf restoration, 0-15 min. 695 0.01 2.49 2.71Logging residues, 15-30 min. 34,885 0.54 3.04 2.77Longleaf restoration, 15-30 min. 4,505 0.07 3.11 2.89Logging residues, 30-45 min. 70,783 1.10 4.21 2.94Longleaf restoration, 30-45 min. 8,277 0.12 4.33 3.07Logging residues, 45-60 min. 75,157 1.17 5.50 3.12Longleaf restoration, 45-60 min. 7,780 0.12 5.62 3.25Logging residues, 60-75 min. 65,916 1.03 6.65 3.29Longleaf restoration, 60-75 min. 6,784 0.10 6.75 3.43Logging residues, 75-90 min. 59,621 0.93 7.68 3.46Longleaf restoration, 75-90 min. 6,728 0.10 7.78 3.60Logging residues, 90-105 min. 88,692 1.38 9.16 3.64Pulpwood, 0-15 min. 18,461 0.30 9.46 3.72Longleaf restoration, 90-105 min. 7,853 0.12 9.58 3.78Logging residues, 105-120 min. 88,368 1.38 10.95 3.81Pulpwood, 15-30 min. 149,402 2.41 13.37 3.88Longleaf restoration, 105-120 min. 8,305 0.12 13.49 3.96Pulpwood, 30-45 min. 320,424 5.18 18.67 4.04Pulpwood, 45-60 min. 345,222 5.58 24.24 4.20Pulpwood, 60-75 min. 291,220 4.70 28.95 4.35Pulpwood, 75-90 min. 259,194 4.19 33.14 4.51Pulpwood, 90-105 min. 390,814 6.31 39.45 4.67Pulpwood, 105-120 min. 387,518 6.26 45.71 4.8383
Table 30. Results for the conservative case projection to 2040 for the JEA Brandy Branchfacility.Cumulative<strong>Resource</strong>/haul time categoryDry tonsrecoverableTBtu/yearRecoverableTBtu/yearrecoverablePrice($/MMBtu)Urban wood, 0-15 min. 8,907 0.13 0.13 0.62Urban wood, 15-30 min. 37,139 0.55 0.69 0.81Urban wood, 30-45 min. 45,780 0.68 1.37 0.99Urban wood, 45-60 min. 21,720 0.32 1.69 1.18Urban wood, 60-75 min. 16,009 0.24 1.93 1.36Urban wood, 75-90 min. 10,365 0.15 2.09 1.55Urban wood, 90-105 min. 10,160 0.15 2.24 1.73Urban wood, 105-120 min. 11,141 0.17 2.41 1.92Logging residues, 0-15 min. 3,862 0.06 2.47 2.60Longleaf restoration, 0-15 min. 695 0.01 2.48 2.71Logging residues, 15-30 min. 27,070 0.42 2.90 2.77Longleaf restoration, 15-30 min. 4,505 0.07 2.97 2.89Logging residues, 30-45 min. 54,830 0.85 3.82 2.94Longleaf restoration, 30-45 min. 8,277 0.12 3.94 3.07Logging residues, 45-60 min. 58,178 0.91 4.85 3.12Longleaf restoration, 45-60 min. 7,780 0.12 4.97 3.25Logging residues, 60-75 min. 51,064 0.80 5.76 3.29Pulpwood, 0-15 min. 14,311 0.23 5.99 3.31Longleaf restoration, 60-75 min. 6,784 0.10 6.10 3.43Logging residues, 75-90 min. 46,274 0.72 6.82 3.46Pulpwood, 15-30 min. 115,616 1.87 8.68 3.47Longleaf restoration, 75-90 min. 6,728 0.10 8.79 3.60Pulpwood, 30-45 min. 247,658 4.00 12.79 3.63Logging residues, 90-105 min. 68,922 1.07 13.86 3.64Longleaf restoration, 90-105 min. 7,853 0.12 13.98 3.78Pulpwood, 45-60 min. 266,607 4.31 18.28 3.78Logging residues, 105-120 min. 68,875 1.07 19.36 3.81Pulpwood, 60-75 min. 225,033 3.64 22.99 3.94Longleaf restoration, 105-120 min. 8,305 0.12 23.12 3.96Pulpwood, 75-90 min. 200,465 3.24 26.36 4.10Pulpwood, 90-105 min. 302,094 4.88 31.24 4.26Pulpwood, 105-120 min. 299,959 4.85 36.08 4.4284
- Page 3 and 4:
ACKNOWLEDGEMENTSThe authors acknowl
- Page 5 and 6:
4.2. Scenario A: Delivered to remot
- Page 7:
Figure 22. Projected softwood and h
- Page 10 and 11:
LIST OF ACRONYMS AND ABBREVIATIONSB
- Page 12 and 13:
1. INTRODUCTION1.1. Project Backgro
- Page 14 and 15:
Task-3: Transportation. Transportat
- Page 16 and 17:
2. TASK 1: WOODSHED DELINEATION AND
- Page 18 and 19:
calculations for urban wood waste a
- Page 20 and 21:
the current pulpwood harvests are a
- Page 22 and 23:
2,0001,800Acres (thousands)1,6001,4
- Page 24 and 25:
ton -1 ($17.38 green ton -1 ) for t
- Page 26 and 27:
$ per million BTU, delivered$4.00$3
- Page 28 and 29:
10.65 TBtu/year required to meet de
- Page 30 and 31:
haul time category in each county,
- Page 32 and 33:
Figure 9. TAL Hopkins two-hour one-
- Page 34 and 35:
Figure 11. GRU, JEA, and TAL woodsh
- Page 36 and 37: Dry tonsrecoverableTBtu/yearRecover
- Page 38 and 39: Dry tonsrecoverableTBtu/yearrecover
- Page 40 and 41: Table 6. Results for scenario #3,
- Page 42 and 43: Table 7. Results for scenario #4,
- Page 44 and 45: Table 9. Results for scenario #6,
- Page 46 and 47: 6.005.004.00$/MMBtu3.002.001.001: W
- Page 48 and 49: Resource/haul time categoryDry tons
- Page 50 and 51: Resource/haul time categoryDry tons
- Page 52 and 53: Table 12. Results for scenario #3,
- Page 54 and 55: Table 13. Results for scenario #4,
- Page 56 and 57: Table 15. Results for scenario #6,
- Page 58 and 59: 6.005.004.00$/MMBtu3.002.001.001: W
- Page 60 and 61: Resource/haul time categoryDry tons
- Page 62 and 63: Resource/haul time categoryDry tons
- Page 64 and 65: Table 18. Results for scenario #3,
- Page 66: Table 19. Results for scenario #4,
- Page 69 and 70: Resource/haul time categoryDry tons
- Page 71 and 72: 2.4.4. General resultsIt is difficu
- Page 73 and 74: Table 22. Yield, acreage required,
- Page 75 and 76: Table 25. Capital construction outp
- Page 77 and 78: 3. TASK 2: SUSTAINABILITY IMPACTS F
- Page 79 and 80: under this scenario are expected to
- Page 81 and 82: acres in 1995 to 8.5 MM acres in 20
- Page 83 and 84: 3.3. RESULTS3.3.1. GRUTable 27. Res
- Page 85: 5.004.504.003.50$/MMBtu3.002.502.00
- Page 89 and 90: 3.3.3. TAL Hopkins facilityTable 31
- Page 91 and 92: 5.004.504.003.50$/MMBtu3.002.502.00
- Page 93 and 94: For GRU most of these do not apply;
- Page 95 and 96: Table 33. Concentration yard costs.
- Page 97 and 98: location of the rail siding and the
- Page 99 and 100: discussed, to get an idea of the pr
- Page 101 and 102: 5. TASK 4: CO 2 EMISSIONS FROM HARV
- Page 103 and 104: in fuel chips and the carbon in fue
- Page 105 and 106: transporting coal. However, because
- Page 107 and 108: 6. COMBINED RESOURCE AVAILABILITYPa
- Page 109 and 110: Resource/haul time categoryTBtu/yea
- Page 111 and 112: Table 39. Combined resources (resou
- Page 113 and 114: Resource/haul time categoryTBtu/yea
- Page 115 and 116: Resource/haul time categoryTBtu/yea
- Page 117 and 118: Resource/haul time categoryTBtu/yea
- Page 119 and 120: OverstockedNatural Stands,0.16, 1%
- Page 121 and 122: logging residues from 90% to 60% to
- Page 123 and 124: ecommend that GRU, in coordination
- Page 125: 9. REFERENCESBlack and Veach (2004)