Table 21. Results for scenario #6, “With competing demand, doubling diesel costs” for the TALHopkins facility.Cumulative<strong>Resource</strong>/haul time categoryDry tonsrecoverable TruckloadsTBtu/yearrecoverableTBtu/yearrecoverablePrice($/MMBtu)Urban wood, 0-15 min. 1,777 224 0.03 0.03 1.28Urban wood, 15-30 min. 8,459 1,068 0.13 0.15 1.52Urban wood, 30-45 min. 10,046 1,268 0.15 0.30 1.76Urban wood, 45-60 min. 5,435 686 0.08 0.38 2.00Urban wood, 60-75 min. 5,329 673 0.08 0.46 2.24Urban wood, 75-90 min. 6,524 824 0.10 0.56 2.48Urban wood, 90-105 min. 8,280 1,045 0.12 0.68 2.72Urban wood, 105-120 min. 12,010 1,516 0.18 0.86 2.96Logging residues, 0-15 min. 2,408 185 0.04 0.90 3.32Overstocked natural, 0-15 min. 352 27 0.01 0.91 3.32Overstocked plantation, 0-15 min. 0 0 0.00 0.91 3.32Overstocked natural, 15-30 min. 2,194 166 0.03 0.94 3.50Overstocked plantation, 15-30 min. 6 0 0.00 0.94 3.50Logging residues, 15-30 min. 13,284 1,019 0.21 1.15 3.55Longleaf restoration, 0-15 min. 1,950 147 0.03 1.18 3.62Overstocked natural, 30-45 min. 4,958 374 0.07 1.25 3.68Overstocked plantation, 30-45 min. 3,388 256 0.05 1.30 3.68Logging residues, 30-45 min. 28,621 2,195 0.45 1.75 3.77Overstocked natural, 45-60 min. 6,006 453 0.09 1.84 3.86Overstocked plantation, 45-60 min. 7,593 573 0.11 1.95 3.86Pulpwood, 0-15 min. 12,006 809 0.19 2.14 3.92Longleaf restoration, 15-30 min. 10,281 776 0.15 2.30 3.98Logging residues, 45-60 min. 45,242 3,469 0.70 3.00 4.00Overstocked natural, 60-75 min. 10,005 755 0.15 3.15 4.04Overstocked plantation, 60-75 min. 10,018 756 0.15 3.30 4.04Pulpwood, 15-30 min. 64,356 4,337 1.04 4.34 4.13Overstocked natural, 75-90 min. 10,355 782 0.16 4.50 4.22Overstocked plantation, 75-90 min. 9,665 729 0.14 4.64 4.22Logging residues, 60-75 min. 70,465 5,403 1.10 5.74 4.22Pulpwood, 30-45 min. 127,007 8,558 2.05 7.79 4.34Longleaf restoration, 30-45 min. 23,409 1,767 0.35 8.14 4.34Overstocked natural, 90-105 min. 9,577 723 0.14 8.29 4.40Overstocked plantation, 90-105min. 19,803 1,495 0.30 8.59 4.40Logging residues, 75-90 min. 91,263 6,998 1.42 10.01 4.45Pulpwood, 45-60 min. 183,562 12,369 2.97 12.97 4.54Overstocked natural, 105-120 min. 4,726 357 0.07 13.04 4.57Overstocked plantation, 105-120min. 24,424 1,843 0.37 13.41 4.57Logging residues, 90-105 min. 92,653 7,105 1.44 14.85 4.67Longleaf restoration, 45-60 min. 34,917 2,635 0.52 15.38 4.69Pulpwood, 60-75 min. 297,376 20,039 4.80 20.18 4.75Logging residues, 105-120 min. 83,753 6,422 1.30 21.49 4.89Pulpwood, 75-90 min. 408,036 27,496 6.59 28.08 4.95Longleaf restoration, 60-75 min. 33,289 2,512 0.50 28.58 5.0565
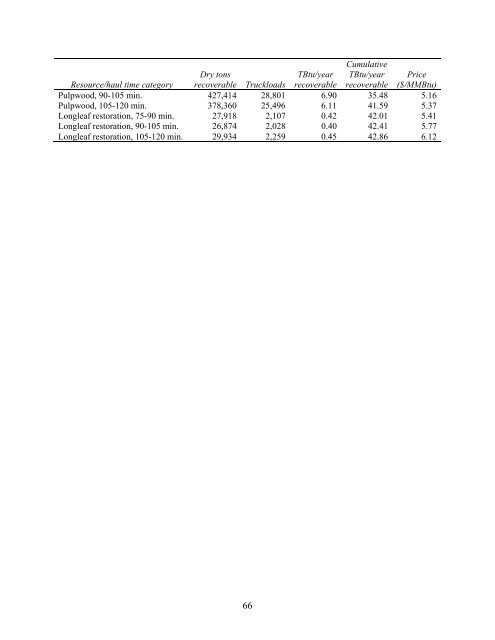
<strong>Resource</strong>/haul time categoryDry tonsrecoverable TruckloadsTBtu/yearrecoverableCumulativeTBtu/yearrecoverablePrice($/MMBtu)Pulpwood, 90-105 min. 427,414 28,801 6.90 35.48 5.16Pulpwood, 105-120 min. 378,360 25,496 6.11 41.59 5.37Longleaf restoration, 75-90 min. 27,918 2,107 0.42 42.01 5.41Longleaf restoration, 90-105 min. 26,874 2,028 0.40 42.41 5.77Longleaf restoration, 105-120 min. 29,934 2,259 0.45 42.86 6.1266
- Page 3 and 4:
ACKNOWLEDGEMENTSThe authors acknowl
- Page 5 and 6:
4.2. Scenario A: Delivered to remot
- Page 7:
Figure 22. Projected softwood and h
- Page 10 and 11:
LIST OF ACRONYMS AND ABBREVIATIONSB
- Page 12 and 13:
1. INTRODUCTION1.1. Project Backgro
- Page 14 and 15:
Task-3: Transportation. Transportat
- Page 16 and 17: 2. TASK 1: WOODSHED DELINEATION AND
- Page 18 and 19: calculations for urban wood waste a
- Page 20 and 21: the current pulpwood harvests are a
- Page 22 and 23: 2,0001,800Acres (thousands)1,6001,4
- Page 24 and 25: ton -1 ($17.38 green ton -1 ) for t
- Page 26 and 27: $ per million BTU, delivered$4.00$3
- Page 28 and 29: 10.65 TBtu/year required to meet de
- Page 30 and 31: haul time category in each county,
- Page 32 and 33: Figure 9. TAL Hopkins two-hour one-
- Page 34 and 35: Figure 11. GRU, JEA, and TAL woodsh
- Page 36 and 37: Dry tonsrecoverableTBtu/yearRecover
- Page 38 and 39: Dry tonsrecoverableTBtu/yearrecover
- Page 40 and 41: Table 6. Results for scenario #3,
- Page 42 and 43: Table 7. Results for scenario #4,
- Page 44 and 45: Table 9. Results for scenario #6,
- Page 46 and 47: 6.005.004.00$/MMBtu3.002.001.001: W
- Page 48 and 49: Resource/haul time categoryDry tons
- Page 50 and 51: Resource/haul time categoryDry tons
- Page 52 and 53: Table 12. Results for scenario #3,
- Page 54 and 55: Table 13. Results for scenario #4,
- Page 56 and 57: Table 15. Results for scenario #6,
- Page 58 and 59: 6.005.004.00$/MMBtu3.002.001.001: W
- Page 60 and 61: Resource/haul time categoryDry tons
- Page 62 and 63: Resource/haul time categoryDry tons
- Page 64 and 65: Table 18. Results for scenario #3,
- Page 66: Table 19. Results for scenario #4,
- Page 71 and 72: 2.4.4. General resultsIt is difficu
- Page 73 and 74: Table 22. Yield, acreage required,
- Page 75 and 76: Table 25. Capital construction outp
- Page 77 and 78: 3. TASK 2: SUSTAINABILITY IMPACTS F
- Page 79 and 80: under this scenario are expected to
- Page 81 and 82: acres in 1995 to 8.5 MM acres in 20
- Page 83 and 84: 3.3. RESULTS3.3.1. GRUTable 27. Res
- Page 85 and 86: 5.004.504.003.50$/MMBtu3.002.502.00
- Page 87 and 88: Table 30. Results for the conservat
- Page 89 and 90: 3.3.3. TAL Hopkins facilityTable 31
- Page 91 and 92: 5.004.504.003.50$/MMBtu3.002.502.00
- Page 93 and 94: For GRU most of these do not apply;
- Page 95 and 96: Table 33. Concentration yard costs.
- Page 97 and 98: location of the rail siding and the
- Page 99 and 100: discussed, to get an idea of the pr
- Page 101 and 102: 5. TASK 4: CO 2 EMISSIONS FROM HARV
- Page 103 and 104: in fuel chips and the carbon in fue
- Page 105 and 106: transporting coal. However, because
- Page 107 and 108: 6. COMBINED RESOURCE AVAILABILITYPa
- Page 109 and 110: Resource/haul time categoryTBtu/yea
- Page 111 and 112: Table 39. Combined resources (resou
- Page 113 and 114: Resource/haul time categoryTBtu/yea
- Page 115 and 116: Resource/haul time categoryTBtu/yea
- Page 117 and 118:
Resource/haul time categoryTBtu/yea
- Page 119 and 120:
OverstockedNatural Stands,0.16, 1%
- Page 121 and 122:
logging residues from 90% to 60% to
- Page 123 and 124:
ecommend that GRU, in coordination
- Page 125:
9. REFERENCESBlack and Veach (2004)