- Page 1 and 2: Organizational Results Research Rep
- Page 3 and 4: TECHNICAL REPORT DOCUMENTATION PAGE
- Page 5 and 6: Executive SummaryOpen to traffic on
- Page 7 and 8: 8. All cables behave elastically un
- Page 9 and 10: Table of ContentsExecutive summary.
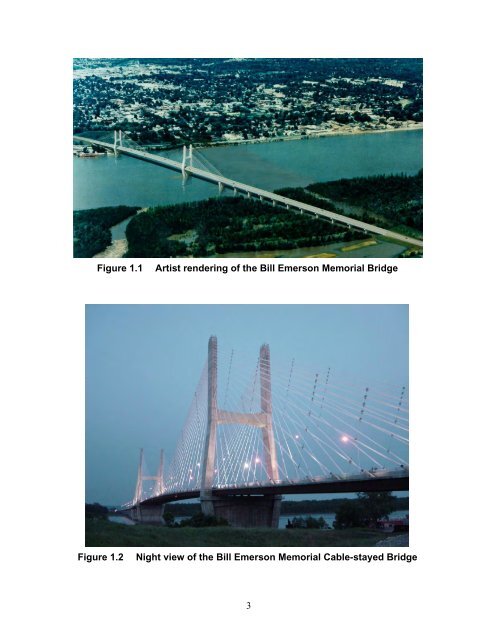
- Page 11 and 12: List of Figure CaptionsFigure 1.1 A
- Page 13 and 14: Figure 5.30 29 th mode shape (1.032
- Page 15: 1. Introduction1.1. GeneralCable-st
- Page 19 and 20: Expansionand lateralearthquakerestr
- Page 21 and 22: 3. Evaluate the model by conducting
- Page 23 and 24: 2. Automatic Retrieval of Peak Acce
- Page 25 and 26: 2.2.3. Map/Find stationsClicking th
- Page 27 and 28: 2.2.5. Displaying seismogramsTo dis
- Page 29 and 30: Figure 2.8Directory chooser2.2.6. S
- Page 31 and 32: 3.2. Seismic instrumentation networ
- Page 33 and 34: The main bridge from Bent 1 to Pier
- Page 35 and 36: (a) South side of deck at support o
- Page 37 and 38: (a) North side of deck at middle of
- Page 39 and 40: The seismic responses at the top (T
- Page 41 and 42: Polyreference Complex Exponential (
- Page 43 and 44: are evaluated and presented in Figu
- Page 45 and 46: 0.353.50.330.252.5Amplitude0.20.15A
- Page 47 and 48: 1 x 10⁻⁴ Frequency(Hz)Amplitude0.90
- Page 49 and 50: Amplitude0.20.180.160.140.120.10.08
- Page 51 and 52: Amplitude0.20.180.160.140.120.10.08
- Page 53 and 54: 1.20.80.400 100 200 300 400 500 600
- Page 55 and 56: 4. Finite Element Modeling of Bill
- Page 57 and 58: Since the cable stays are connected
- Page 59 and 60: Table 4.3Initial property of cables
- Page 61 and 62: Table 4.4Spring and damping coeffic
- Page 63 and 64: (a) View of the entire bridge(b) Vi
- Page 65 and 66: 4.6. RemarksA detailed 3-D FE model
- Page 67 and 68:
knω = (5.4)nm nSimilarly, when dam
- Page 69 and 70:
mainly corresponds to the vertical
- Page 71 and 72:
thFigure 5.10 9 mode shape (0.740Hz
- Page 73 and 74:
thFigure 5.19 18 mode shape (0.947H
- Page 75 and 76:
Figure 5.27 26 th mode shape (0.977
- Page 77 and 78:
When the bridge deck moves up and d
- Page 79 and 80:
1.1Frequency (Hz)0.90.70.5BC Case 1
- Page 81 and 82:
1.1Frequency(Hz)0.90.70.5Plus 0Plus
- Page 83 and 84:
no difference among the three cases
- Page 85 and 86:
The FE model of the bridge was vali
- Page 87 and 88:
10.6TestFE model0.2-0.20 100 200 30
- Page 89 and 90:
1.20.80.40-0.4TestFE model0 100 200
- Page 91 and 92:
differences is that the exact locat
- Page 93 and 94:
(a) Vertical acceleration time hist
- Page 95 and 96:
The FE model of the cable-stayed br
- Page 97 and 98:
Displacement (m)0.30.20.10-0.1-0.2X
- Page 99 and 100:
Station D1 (before amplification) a
- Page 101 and 102:
ending of the tower as shown in Fig
- Page 103 and 104:
symmetric about the centerline of t
- Page 105 and 106:
Tensile stress (MPa)800750700650600
- Page 107 and 108:
7. Conclusions and RecommendationsB
- Page 109 and 110:
The vast arrays of acceleration dat
- Page 111 and 112:
14. Cunha A, Caetano and Delgado T.
- Page 113 and 114:
42. Song, W., Giraldo, D.F., Clayto
- Page 115 and 116:
Figure A.2 Vertical stiffness and d
- Page 117 and 118:
A.2 Group Interaction FactorThe cro
- Page 119 and 120:
For a group of piles with identical
- Page 121:
Missouri Department of Transportati