

Assessment of the Bill Emerson Memorial Bridge - FTP Directory ...
Assessment of the Bill Emerson Memorial Bridge - FTP Directory ...
Assessment of the Bill Emerson Memorial Bridge - FTP Directory ...
- No tags were found...

Create successful ePaper yourself
Turn your PDF publications into a flip-book with our unique Google optimized e-Paper software.
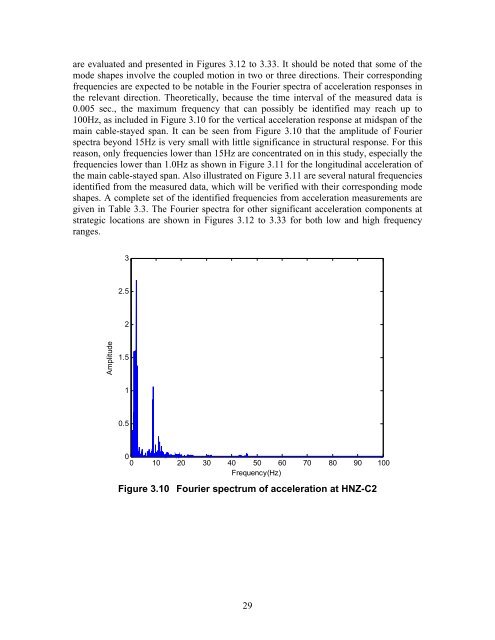
are evaluated and presented in Figures 3.12 to 3.33. It should be noted that some <strong>of</strong> <strong>the</strong>mode shapes involve <strong>the</strong> coupled motion in two or three directions. Their correspondingfrequencies are expected to be notable in <strong>the</strong> Fourier spectra <strong>of</strong> acceleration responses in<strong>the</strong> relevant direction. Theoretically, because <strong>the</strong> time interval <strong>of</strong> <strong>the</strong> measured data is0.005 sec., <strong>the</strong> maximum frequency that can possibly be identified may reach up to100Hz, as included in Figure 3.10 for <strong>the</strong> vertical acceleration response at midspan <strong>of</strong> <strong>the</strong>main cable-stayed span. It can be seen from Figure 3.10 that <strong>the</strong> amplitude <strong>of</strong> Fourierspectra beyond 15Hz is very small with little significance in structural response. For thisreason, only frequencies lower than 15Hz are concentrated on in this study, especially <strong>the</strong>frequencies lower than 1.0Hz as shown in Figure 3.11 for <strong>the</strong> longitudinal acceleration <strong>of</strong><strong>the</strong> main cable-stayed span. Also illustrated on Figure 3.11 are several natural frequenciesidentified from <strong>the</strong> measured data, which will be verified with <strong>the</strong>ir corresponding modeshapes. A complete set <strong>of</strong> <strong>the</strong> identified frequencies from acceleration measurements aregiven in Table 3.3. The Fourier spectra for o<strong>the</strong>r significant acceleration components atstrategic locations are shown in Figures 3.12 to 3.33 for both low and high frequencyranges.32.52Amplitude1.510.500 10 20 30 40 50 60 70 80 90 100Frequency(Hz)Figure 3.10 Fourier spectrum <strong>of</strong> acceleration at HNZ-C229


