

Assessment of the Bill Emerson Memorial Bridge - FTP Directory ...
Assessment of the Bill Emerson Memorial Bridge - FTP Directory ...
Assessment of the Bill Emerson Memorial Bridge - FTP Directory ...
- No tags were found...

You also want an ePaper? Increase the reach of your titles
YUMPU automatically turns print PDFs into web optimized ePapers that Google loves.
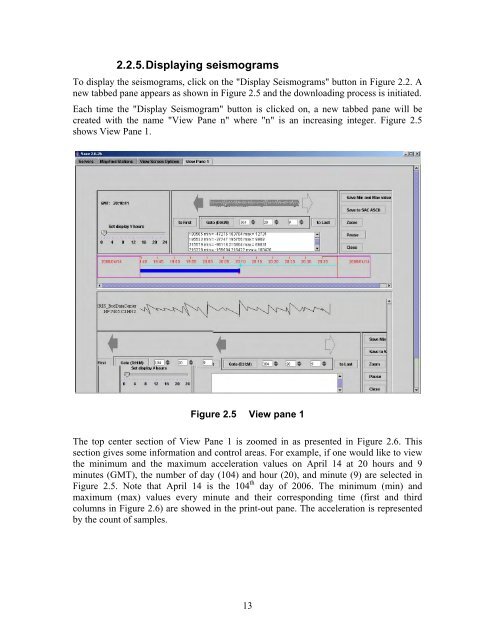
2.2.5. Displaying seismogramsTo display <strong>the</strong> seismograms, click on <strong>the</strong> "Display Seismograms" button in Figure 2.2. Anew tabbed pane appears as shown in Figure 2.5 and <strong>the</strong> downloading process is initiated.Each time <strong>the</strong> "Display Seismogram" button is clicked on, a new tabbed pane will becreated with <strong>the</strong> name "View Pane n" where "n" is an increasing integer. Figure 2.5shows View Pane 1.Figure 2.5 View pane 1The top center section <strong>of</strong> View Pane 1 is zoomed in as presented in Figure 2.6. Thissection gives some information and control areas. For example, if one would like to view<strong>the</strong> minimum and <strong>the</strong> maximum acceleration values on April 14 at 20 hours and 9minutes (GMT), <strong>the</strong> number <strong>of</strong> day (104) and hour (20), and minute (9) are selected inFigure 2.5. Note that April 14 is <strong>the</strong> 104 th day <strong>of</strong> 2006. The minimum (min) andmaximum (max) values every minute and <strong>the</strong>ir corresponding time (first and thirdcolumns in Figure 2.6) are showed in <strong>the</strong> print-out pane. The acceleration is representedby <strong>the</strong> count <strong>of</strong> samples.13


