

Assessment of the Bill Emerson Memorial Bridge - FTP Directory ...
Assessment of the Bill Emerson Memorial Bridge - FTP Directory ...
Assessment of the Bill Emerson Memorial Bridge - FTP Directory ...
- No tags were found...

Create successful ePaper yourself
Turn your PDF publications into a flip-book with our unique Google optimized e-Paper software.
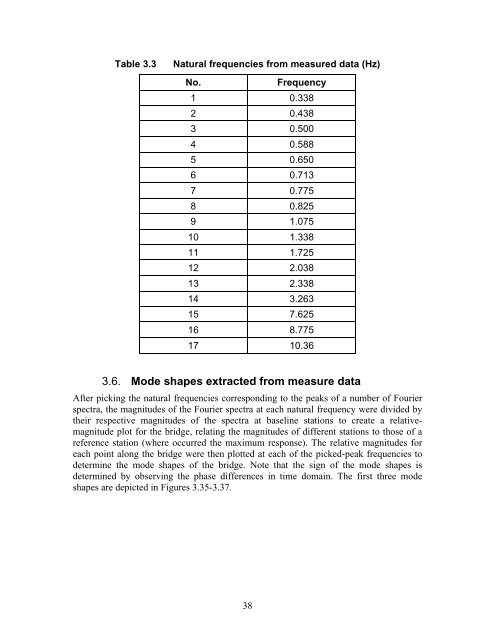
Table 3.3Natural frequencies from measured data (Hz)No.Frequency1 0.3382 0.4383 0.5004 0.5885 0.6506 0.7137 0.7758 0.8259 1.07510 1.33811 1.72512 2.03813 2.33814 3.26315 7.62516 8.77517 10.363.6. Mode shapes extracted from measure dataAfter picking <strong>the</strong> natural frequencies corresponding to <strong>the</strong> peaks <strong>of</strong> a number <strong>of</strong> Fourierspectra, <strong>the</strong> magnitudes <strong>of</strong> <strong>the</strong> Fourier spectra at each natural frequency were divided by<strong>the</strong>ir respective magnitudes <strong>of</strong> <strong>the</strong> spectra at baseline stations to create a relativemagnitudeplot for <strong>the</strong> bridge, relating <strong>the</strong> magnitudes <strong>of</strong> different stations to those <strong>of</strong> areference station (where occurred <strong>the</strong> maximum response). The relative magnitudes foreach point along <strong>the</strong> bridge were <strong>the</strong>n plotted at each <strong>of</strong> <strong>the</strong> picked-peak frequencies todetermine <strong>the</strong> mode shapes <strong>of</strong> <strong>the</strong> bridge. Note that <strong>the</strong> sign <strong>of</strong> <strong>the</strong> mode shapes isdetermined by observing <strong>the</strong> phase differences in time domain. The first three modeshapes are depicted in Figures 3.35-3.37.38


