assets - TIAA-CREF
assets - TIAA-CREF
assets - TIAA-CREF
- No tags were found...

Create successful ePaper yourself
Turn your PDF publications into a flip-book with our unique Google optimized e-Paper software.
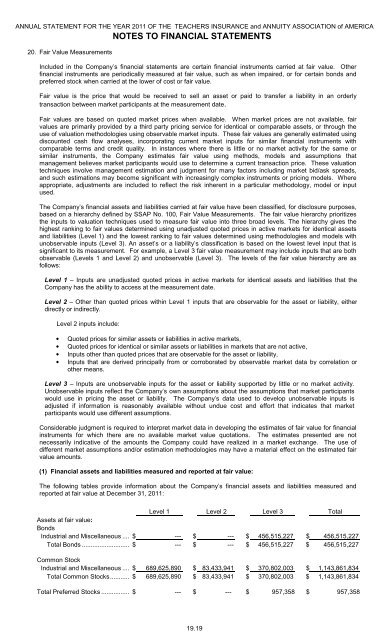
ANNUAL STATEMENT FOR THE YEAR 2011 OF THE TEACHERS INSURANCE and ANNUITY ASSOCIATION of AMERICA20. Fair Value MeasurementsNOTES TO FINANCIAL STATEMENTSIncluded in the Company’s financial statements are certain financial instruments carried at fair value. Otherfinancial instruments are periodically measured at fair value, such as when impaired, or for certain bonds andpreferred stock when carried at the lower of cost or fair value.Fair value is the price that would be received to sell an asset or paid to transfer a liability in an orderlytransaction between market participants at the measurement date.Fair values are based on quoted market prices when available. When market prices are not available, fairvalues are primarily provided by a third party pricing service for identical or comparable <strong>assets</strong>, or through theuse of valuation methodologies using observable market inputs. These fair values are generally estimated usingdiscounted cash flow analyses, incorporating current market inputs for similar financial instruments withcomparable terms and credit quality. In instances where there is little or no market activity for the same orsimilar instruments, the Company estimates fair value using methods, models and assumptions thatmanagement believes market participants would use to determine a current transaction price. These valuationtechniques involve management estimation and judgment for many factors including market bid/ask spreads,and such estimations may become significant with increasingly complex instruments or pricing models. Whereappropriate, adjustments are included to reflect the risk inherent in a particular methodology, model or inputused.The Company’s financial <strong>assets</strong> and liabilities carried at fair value have been classified, for disclosure purposes,based on a hierarchy defined by SSAP No. 100, Fair Value Measurements. The fair value hierarchy prioritizesthe inputs to valuation techniques used to measure fair value into three broad levels. The hierarchy gives thehighest ranking to fair values determined using unadjusted quoted prices in active markets for identical <strong>assets</strong>and liabilities (Level 1) and the lowest ranking to fair values determined using methodologies and models withunobservable inputs (Level 3). An asset’s or a liability’s classification is based on the lowest level input that issignificant to its measurement. For example, a Level 3 fair value measurement may include inputs that are bothobservable (Levels 1 and Level 2) and unobservable (Level 3). The levels of the fair value hierarchy are asfollows:Level 1 – Inputs are unadjusted quoted prices in active markets for identical <strong>assets</strong> and liabilities that theCompany has the ability to access at the measurement date.Level 2 – Other than quoted prices within Level 1 inputs that are observable for the asset or liability, eitherdirectly or indirectly.Level 2 inputs include:• Quoted prices for similar <strong>assets</strong> or liabilities in active markets,• Quoted prices for identical or similar <strong>assets</strong> or liabilities in markets that are not active,• Inputs other than quoted prices that are observable for the asset or liability,• Inputs that are derived principally from or corroborated by observable market data by correlation orother means.Level 3 – Inputs are unobservable inputs for the asset or liability supported by little or no market activity.Unobservable inputs reflect the Company’s own assumptions about the assumptions that market participantswould use in pricing the asset or liability. The Company’s data used to develop unobservable inputs isadjusted if information is reasonably available without undue cost and effort that indicates that marketparticipants would use different assumptions.Considerable judgment is required to interpret market data in developing the estimates of fair value for financialinstruments for which there are no available market value quotations. The estimates presented are notnecessarily indicative of the amounts the Company could have realized in a market exchange. The use ofdifferent market assumptions and/or estimation methodologies may have a material effect on the estimated fairvalue amounts.(1) Financial <strong>assets</strong> and liabilities measured and reported at fair value:The following tables provide information about the Company’s financial <strong>assets</strong> and liabilities measured andreported at fair value at December 31, 2011:Level 1 Level 2 Level 3 TotalAssets at fair value:BondsIndustrial and Miscellaneous ......$ --- $ --- $ 456,515,227 $ 456,515,227Total Bonds .............................$ --- $ --- $ 456,515,227 $ 456,515,227Common StockIndustrial and Miscellaneous ......$ 689,625,890 $ 83,433,941 $ 370,802,003 $ 1,143,861,834Total Common Stocks.............$ 689,625,890 $ 83,433,941 $ 370,802,003 $ 1,143,861,834Total Preferred Stocks ..................$ --- $ --- $ 957,358 $ 957,35819.19