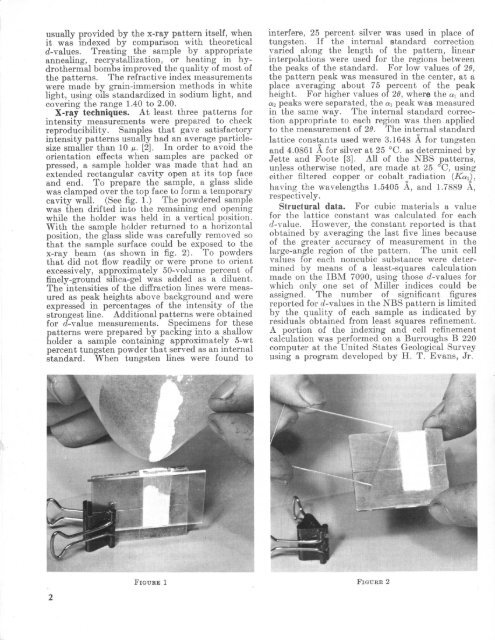
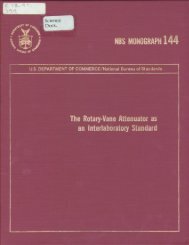
usually provided by the x-<strong>ray</strong> pattern itself, whenit was indexed by comparison with theoretical^-values. Treating the sample by appropriateannealing, recrystallization, or heating in hydro thermal bombs improved the quality of most ofthe patterns. The refractive index measurementswere made by grain-immersion methods in whitelight, using oils standardized in sodium light, andcovering the range 1.40 to 2.00.X-<strong>ray</strong> techniques. At least three patterns forintensity measurements were prepared to checkreproducibility. Samples that gave satisfactoryintensity patterns usually had an average particlesizesmaller than 10 i*. [2]. In order to avoid theorientation effects when samples are packed orpressed, a sample holder was made that had anextended rectangular cavity open at its top faceand end. To prepare the sample, a glass slidewas clamped over the top face to form a temporarycavity wall. (See fig. 1.) The powdered samplewas then drifted into the remaining end openingwhile the holder was held in a vertical position.With the sample holder returned to a horizontalposition, the glass slide was carefully removed sothat the sample surface could be exposed to thex-<strong>ray</strong> beam (as shown in fig. 2). To powdersthat did not flow readily or were prone to orientexcessively, approximately 50-volume percent offinely-ground silica-gel was added as a diluent.The intensities of the diffraction lines were measured as peak heights above background and wereexpressed in percentages of the intensity of thestrongest line. Additional patterns were obtainedfor d-value measurements. Specimens for thesepatterns were prepared by packing into a shallowholder a sample containing approximately 5-wtpercent tungsten powder that served as an internalstandard. When tungsten lines were found tointerfere, 25 percent silver was used in place oftungsten. If the internal standard correctionvaried along the length of the pattern, linearinterpolations were used for the regions betweenthe peaks of the standard. For low values of 26,the pattern peak was measured in the center, at aplace averaging about 75 percent of the peakheight. For higher values of 26, where the on and«2 peaks were separated, the ai peak was measuredin the same way. The internal standard correction appropriate to each region was then appliedto the measurement of 26. The internal standardlattice constants used were 3.1648 A for tungstenand 4.0861 A for silver at 25 C. as determined byJette and Fopte [3]. All of the NBS patterns,unless otherwise noted, are made at 25 C, usingeither filtered copper or cobalt radiation (Ken),o ohaving the wavelengths 1.5405 A, and 1.7889 A,respectively.Structural data. For cubic materials a valuefor the lattice constant was calculated for eachd-value. However, the constant reported is thatobtained by averaging the last five lines becauseof the greater accuracy of measurement in thelarge-angle region of the pattern. The unit cellvalues for each noncubic substance were determined by means of a least-squares calculationmade on the IBM 7090, using those d-values forwhich only one set of Miller indices could beassigned. The number of significant figuresreported for {/-values in the NBS pattern is limitedby the quality of each sample as indicated byresiduals obtained from least squares refinement.A portion of the indexing and cell refinementcalculation was performed on a Burroughs B 220computer at the United States Geological Surveyusing a program developed by H. T. Evans, Jr.FIGURE 1 FIGURE 2
D. E. Appleman, and D. Handworker. Latticeconstant errors are given only for data refined onthat program and are based on least squaresrefinement of the variance-covariance matrixderived from the unweighted A0 residuals.Published unit cell data in kX units wereconverted to angstrom units using the factor1.00202 as recommended by an internationalconference of crystallographers [4].The space groups are listed with both theSchoenflies and short Hermann-Mauguin symbolsas well as the space group numbers given in theInternational Tables for X-<strong>ray</strong> Crystallography[5],Orthorhombic cell dimensions are presentedaccording to the Dana convention [6] 6>a>c.The densities calculated from the NBS latticeconstants are expressed in grams per cubiccentimeter and are computed with atomic weightsbased on carbon 12 [7], and the Avogadro number(6.02252 X10 23 ).References[1] Index to the X-<strong>ray</strong> <strong>Powder</strong> Data File, AmericanSociety for Testing and Materials, 1916 Race Street.Philadelphia 3, Pa. (1962).[2] L. Alexander, H. P. Klug, and E. Kummer, Statisticalfactors affecting the intensity of x-<strong>ray</strong>s diffracted bycrystalline powders, J. Appl. Phys. 19, No. 8,742-753 (1948).[3] E. R. Jette and F. Foote, Precision determination oflattice constants, J. Chem. Phys. 3, 605-616 (1935).[4] The conversion factor for kX units to angstrom units,J. Sci. Inst. 24,27 (1947).[5] International Tables for X-<strong>ray</strong> Crystallography, 1,1952.[6] Dana's System of Mineralogy, 1, 6 (1944).[7] International Union of Pure and Applied Chemistry,Chem. Eng. News, Nov. 20, 43 (1961).Aluminum 3:2 Silicate (mullite)* 3A12O3 • 2SiO2 (orthorhombic)<strong>Powder</strong> data cardsCardnumber6-025810-394Indexlines3.382. 203.413. 393.422.54SourceF. H. Cillery [1].H. Scholze [2] 1955.Additional published patterns. Norton [3]1925, Navias and Davey [4] 1925; Wyckoff,Grieg, and Bo wen [5] 1926; Mark and Rosbaud[6] 1926; Nahmias [7] 1933; Comeforo, Fischer,and Bradley [8] 1948; and Kurylenko [9] 1952.NBS sample. The sample of aluminum 3:2silicate was prepared at NBS by C. Bobbins.Gamma A1203 and SiO2-nR 2O were mechanicallymixed in stoichiometric proportions of 3A12 O3 to2SiO2-7iH2O. This mixture was pressed into pellets and fired at 1400 C and 1500 C with littlereaction, then remixed and fired in an open systemat 1700 C for 24 hr. Reaction was nearly complete. It was crushed, reground in an agatemortar and refired at 1725 C for 24 hr. Chemicalanalysis of the finished product showed 61.6 molepercent A12O3 and 38.4 mole percent SiO2 insteadof the beginning percentages of 60 and 40 in the3:2 mixture. Spectrographic analysis showed thefollowing major impurities: 0.01 to 0.1 percentiron, and 0.001 to 0.01 percent each of calcium,chromium, magnesium, manganese, nickel, titanium, and zirconium.*Some disagreement exists in the literature as to which ratio or ratios ofalumina to silica should be considered for mullite (3:2, 2:1, or both).This sample was prepared as 3:2 at the request of P. Schroth of the ArmcoSteel Corp. to be used as an identification, diffraction standard for mullitein refractory brick.The sample was colorless and optically positivewith the indices of refraction Na= 1.637, N$ =1.641, and N T =1.652.The ^-values of the othree strongest lines are:3.390, 3.428 and 2.206 A.Structural data. Sadanaga, Tokonami, andTakeuchi [10] in 1962 determined that mullitehas the space group Dlh-Pbam (No. 55). Wyckoff, Grieg, and Bowen [5] in 1926 determined thatmullite has 3/4(3Al2O 3-2SiO2 ) per unit cell. Several lattice constants have been converted fromkX to angstrom units for comparison with theNBS values.19261928193319521955196019621963Wyckoff, Grieg,and Bowen [5],Taylor [!!] . ...Nahmias [7]Kurylenko [9]___Scholze [2]_ ____Agrell and Smith[12].Sadanaga,Tokonami,and Takeuchi[10].National Bureauof <strong>Standard</strong>sat 25 C.*These values are for 2AliO8-SiOi.Lattice constantsaoA7. 527. 517. 547. 5807. 5377. 5582*7. 5837. 5456. 0004bA7. 687. 657. 677. 6897. 6717. 6878*7. 6817. 6898. 0005cA2. 862. 882. 902. 8952. 8782. 8843*2. 88542. 8842. 0002The density calculated from the NBS latticeconstants is 3.170 g/cm3 at 25 C.
- Page 1 and 2: c ^r.
- Page 3 and 4: UNITED STATES DEPARTMENT OF COMMERC
- Page 5 and 6: Introduction.. _ __________________
- Page 7: STANDARD X-RAY DIFFRACTION POWDER P
- Page 11 and 12: Ammonium Fluoberyllate, (NH4) 2BeF4
- Page 13 and 14: Ammonium Fluoborate, NH4BF4 (orthor
- Page 15 and 16: Arsenic Trioxide, claudetite, As2O3
- Page 17 and 18: Powder data cardsBarium Stannate, B
- Page 19 and 20: Bismuth Orthophosphate, BiPO4 (trig
- Page 21 and 22: Bismuth Orthovanadate (high form),
- Page 23 and 24: Bismuth Telluride (tellurobismuthit
- Page 25 and 26: Cadmium Perchlorate Hexahydrate, Cd
- Page 27 and 28: Cadmium Telluride, CdTe (cubic)Powd
- Page 29 and 30: Calcium Fluoride Phosphate (fluorap
- Page 31 and 32: Cesium Chromate, Cs>CrO 4 (orthorho
- Page 33 and 34: Cobalt Fluosilkate Hexahydrate, CoS
- Page 35 and 36: Copper Sulfate (chalcocyanite), CuS
- Page 37 and 38: Erbium Arsenate, ErAsO4 (tetragonal
- Page 39 and 40: Gallium Arsenide, GaAs (cubic)Powde
- Page 41 and 42: Indium Arsenide, InAs (cubic)Powder
- Page 43 and 44: Lanthanum Niobium Titanium Oxide, L
- Page 45 and 46: Lithium Phosphate, high form, Li3PO
- Page 47 and 48: Magnesium Ammonium Phosphate Hexahy
- Page 49 and 50: Potossium Chlorate, KCIO3 (monoclin
- Page 51 and 52: Potassium Zinc Decavanadate 16 Hydr
- Page 53 and 54: Silver Antimony Telluride, AgSbTe2
- Page 55 and 56: Sodium Trimetaphosphate, Na3P3O9 (o
- Page 57 and 58: Sodium Trimetaphosphate Monohydrate
- Page 59 and 60:
Strontium 1:1 Berate, SrO-B2O3 (ort
- Page 61 and 62:
Thallium Chromate, Tl2CrO4 (orthorh
- Page 63 and 64:
Titanium Dioxide, brookite, TiO2 (o
- Page 65 and 66:
CUMULATIVE INDEX TO CIRCULAR 539, V
- Page 67 and 68:
CUMULATIVE INDEX TO CIRCULAR 539, V
- Page 69 and 70:
CUMULATIVE INDEX TO CIRCULAR 539, V