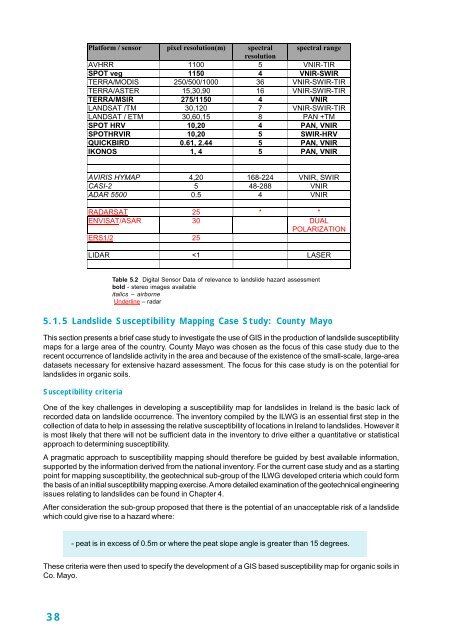
Platform / sensor pixel resolution(m) spectral spectral rangeresolutionAVHRR 1100 5 VNIR-TIRSPOT veg 1150 4 VNIR-SWIRTERRA/MODIS 250/500/1000 36 VNIR-SWIR-TIRTERRA/ASTER 15,30,90 16 VNIR-SWIR-TIRTERRA/MSIR 275/1150 4 VNIRLANDSAT /TM 30,120 7 VNIR-SWIR-TIRLANDSAT / ETM 30,60,15 8 PAN +TMSPOT HRV 10,20 4 PAN, VNIRSPOTHRVIR 10,20 5 SWIR-HRVQUICKBIRD 0.61, 2.44 5 PAN, VNIRIKONOS 1, 4 5 PAN, VNIRAVIRIS HYMAP 4,20 168-224 VNIR, SWIRCASI-2 5 48-288 VNIRADAR 5500 0.5 4 VNIRRADARSAT 25 * *ENVISAT/ASAR 30 DUALPOLARIZATIONERS1/2 25LIDAR
Available datasetsThe first task in developing a susceptibility map involves an assessment <strong>of</strong> the available data. The followingdatasets were available for the case study:Theme Source Scale ExtentSoilAn Foras Taluntais 1:127,560 Western half <strong>of</strong> MayoEPA Soil & Subsoil 1:50,000-1:100,000 Entire countyMapping Project (Nominal)LandcoverEPA Soil & Subsoil 1 Ha grid cell resolution Entire countyMapping ProjectSlope EPA-Teagasc DEM 20m grid cell resolution Entire countyTable 5.3 Datasets available for Co. Mayo case studyDataset background informationAt the outset <strong>of</strong> the EPA Soil & Subsoil Mapping Project (initially established as the FIPS-IFS project), lessthan half <strong>of</strong> the country’s soils had been surveyed and published at a detailed reconnaissance (1:126,720)scale (Fealy et al., 2004). This necessitated the development <strong>of</strong> soil mapping for the remainder <strong>of</strong> the countryat a similar scale. Due <strong>to</strong> the short project time frame, remote sensing and GIS techniques were incorporatedin<strong>to</strong> the project methodology.The EPA Soil & Subsoil Mapping Project developed a methodology for the creation <strong>of</strong> a first-approximation soilclassification for those areas not previously surveyed by the National Soil <strong>Survey</strong>. This also involved the production<strong>of</strong> a subsoils map for the entire country using stereo-pho<strong>to</strong>grammetric interpretation supported by field work.The use <strong>of</strong> stereo-pho<strong>to</strong>grammetric image pairs facilitated viewing <strong>of</strong> the landscape in a simulated 3-dimensionalenvironment. This technique is well established in soil survey methodology and is widely used internationally.Map units are discriminated using visual signals from the imagery such as texture, <strong>to</strong>ne and appearance alongwith contextual information provided by 3D viewing. Vegetation overlying peat is generally very easilydiscriminated from the imagery, facilitating generally high accuracy levels for the classification <strong>of</strong> peat.Within the same project, a landcover map <strong>of</strong> <strong>Ireland</strong> has been developed using supervised classification <strong>of</strong>satellite imagery acquired by the Thematic Mapper (TM) sensor on board Landsat 5. The resulting land coverthematic map illustrates the distribution <strong>of</strong> land cover classes. These classes represent groupings <strong>of</strong> vegetationtypes, developed from aerial pho<strong>to</strong>graphic training data, and are indicative <strong>of</strong> vegetation type in a broad sense.The EPA-Teagasc DEM was developed using ANUDEM s<strong>of</strong>tware and the Ordnance <strong>Survey</strong> <strong>of</strong> <strong>Ireland</strong> 1:50,000data as input. (Pres<strong>to</strong>n and Mills, 2002).The National Soil <strong>Survey</strong> (NSS) was initiated in 1959, shortly after the establishment <strong>of</strong> An Foras Taluntais(AFT), the precursor organisation <strong>to</strong> Teagasc. During the period <strong>of</strong> operation <strong>of</strong> the NSS, a number <strong>of</strong> soilsurvey outputs were produced at varying scales. Chief amongst these was the publication <strong>of</strong> 1:127,560 scalemapping for approximately 44% <strong>of</strong> the country.The NSS Soil Map <strong>of</strong> West Mayo was developed using the established methods <strong>of</strong> soil survey used in othercounties in <strong>Ireland</strong>. This involved mapping soils in the field and the production <strong>of</strong> a reduced scale soil map forpublication at 1:127,560 scale. Although available for only half <strong>of</strong> Co. Mayo, the map provided a very usefuldataset <strong>to</strong> assess the other datasets used in this case study.Methodology and resultsThe production <strong>of</strong> the susceptibility map based on the criteria supplied by the geotechnical sub-group isrelatively straightforward in the sense <strong>of</strong> the GIS methodology used. In simple terms, it requires the input <strong>of</strong> aslope map, a peat map, and the application <strong>of</strong> the criteria thresholds.The development <strong>of</strong> a slope map for Co. Mayo for this case study was straightforward. The slope map wasproduced in ESRI Grid format using ESRI ArcView s<strong>of</strong>tware. Conceptually, the slope request fits a plane <strong>to</strong> a3x3 cell neighbourhood <strong>of</strong> height values from the DEM around the processing or centre cell. The slope for thecell is calculated from the 3x3 neighbourhood using an average maximum technique.The development <strong>of</strong> a peat map suitable for use in mapping susceptibility, although theoretically straightforward,is a somewhat more difficult task. This is illustrated by the results <strong>of</strong> the first run <strong>of</strong> the susceptibility model.39
- Page 1 and 2:
Landslides in IrelandGeological Sur
- Page 3 and 4: LANDSLIDESinIRELANDEditorRonnie Cre
- Page 5 and 6: CONTENTSPreface ...................
- Page 7 and 8: Fig. 4.3 Forces caused by water in
- Page 9 and 10: PREFACEUntil recently Ireland has b
- Page 11 and 12: een very important in populating th
- Page 13 and 14: involves a report on the current st
- Page 15 and 16: Main Objectives• Increase public/
- Page 17 and 18: 1. INTRODUCTIONRonnie Creighton1.1
- Page 19: 1.3 The Landslides PublicationThis
- Page 22 and 23: Peat flows are not nearly so well d
- Page 24 and 25: In Ireland the Quaternary or uncons
- Page 26 and 27: Journal - published papersLetter -
- Page 28 and 29: Fig. 3.1 Two images showing the use
- Page 30 and 31: Table 3.1 Landslide Events Per Coun
- Page 32 and 33: Fig. 3.3 Location map of the Pollat
- Page 34 and 35: 3.7.4 Quaternary GeologyQuaternary
- Page 36 and 37: 3.8 The Derrybrien Landslide - 2003
- Page 38 and 39: • The classification scheme shoul
- Page 40 and 41: The force causing the block to slid
- Page 42 and 43: Plate 4.1 Herringbone drainage syst
- Page 44 and 45: 1210Number of events864Raised bogBl
- Page 46 and 47: It is well known by research at Uni
- Page 48 and 49: 5. LANDSLIDE SUSCEPTIBILITY MAPPING
- Page 50 and 51: Two simplified hypothetical example
- Page 52 and 53: 5.1.4 Mapping and GISBy definition,
- Page 56 and 57: For this initial run, the criteria
- Page 58 and 59: 42Fig. 5.5 Peat and peaty podzols f
- Page 60 and 61: for susceptibility mapping purposes
- Page 62 and 63: elationships between developed susc
- Page 64 and 65: The methodology used to derive the
- Page 66 and 67: 50Fig. 5.12. Landslide susceptibili
- Page 68 and 69: 52Table 5.6. Landslide classificati
- Page 70 and 71: The percentage of events occurring
- Page 72 and 73: with slope, overall 20-25% of all e
- Page 74 and 75: As the dataset was not available at
- Page 79 and 80: CHAPTER 5.2 - TABLE APPENDIXBedrock
- Page 81 and 82: 6. LANDSLIDES AND PLANNINGAileen Do
- Page 83 and 84: 6.2.4 Development ManagementThe phy
- Page 85 and 86: 6.5 Current Practice on Landslides
- Page 88 and 89: 7. LANDSLIDES IN NORTHERN IRELANDTe
- Page 90 and 91: 2. MudflowsPlate 7.1 Rotational Lan
- Page 92 and 93: 7.2 Carboniferous Cliff Lines (Co F
- Page 95 and 96: 8. RESEARCH ON IRISH LANDSLIDESKoen
- Page 97 and 98: 8.4 Research. Post-2003 AbstractsTa
- Page 99 and 100: Identifying, recognizing, and predi
- Page 101 and 102: In the case of vulnerability mappin
- Page 103 and 104: Steep slopes in glacial tillMichael
- Page 105 and 106:
9. RECOMMENDATIONS FOR FUTURE WORK9
- Page 107 and 108:
Priority 1 Peat slides and peat str
- Page 109 and 110:
TEXT REFERENCESAcreman, M., 1991. T
- Page 111 and 112:
Skipper, J., Follett, B., Menkiti,
- Page 113 and 114:
APPENDIX 2Glossary of TermsBlanket
- Page 115 and 116:
APPENDIX 3Nomenclature for Landslid
- Page 117 and 118:
APPENDIX 4101
- Page 119 and 120:
103
- Page 121 and 122:
105
- Page 123 and 124:
Hammond, R. 1979. The Peatlands of
- Page 125:
APPENDIX 7Useful Web Linkswww.gsi.i