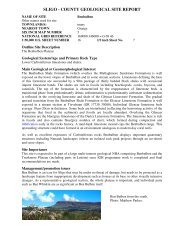
to download report - Geological Survey of Ireland
to download report - Geological Survey of Ireland
to download report - Geological Survey of Ireland
- No tags were found...

Create successful ePaper yourself
Turn your PDF publications into a flip-book with our unique Google optimized e-Paper software.
The methodology used <strong>to</strong> derive the final susceptibility maps was compiled from several literature examples(Santacana et al. 2003, Tangestani 2003, Mor<strong>to</strong>n et al. 2003). Due <strong>to</strong> the large extent <strong>of</strong> the study area (2129.7Km 2 ) and the short length <strong>of</strong> time available for fieldwork (less than one month), mapping was mainly based onremote sensing techniques such as satellite imagery, aerial pho<strong>to</strong>graphy and orthopho<strong>to</strong>graphy analysis. Allthese datasets were combined with digital elevation models (DEM) <strong>to</strong> facilitate identification and classification<strong>of</strong> landslide events.5.2.2 DatasetsThe datasets used during the landslide mapping and analysis are displayed in Tables 5.1 and 5.2. All datasetshave been tested and a selection was finally made for this project. This decision was based on the scale orresolution <strong>of</strong> the dataset. High spatial resolution datasets (>1:20,000) have been found <strong>to</strong> be more efficient forlandslide mapping.Several thematic datasets were viewed and compared <strong>to</strong> assess which ones would be used during the finalanalysis. Landcover, Bedrock Geology, Quaternary Geology and rock outcrop maps were available for theproject and details <strong>of</strong> these datasets are displayed in Table 5.1. Several landcover maps were available for thisproject. The Landcover Thematic map supplied by Teagasc was considered the most suitable. Some areas <strong>of</strong>this dataset were characterized as “Unclassified” and in those areas the Corine landcover map was used <strong>to</strong>input the class instead. Other thematic datasets used were a Bedrock Geology map at 1:100,000 scale fromthe <strong>Geological</strong> <strong>Survey</strong> <strong>of</strong> <strong>Ireland</strong> (GSI) and the Irish Forestry Soil (IFS) parent material maps (available only forCo. Sligo and Co. Cavan) produced by the Spatial Analysis Group in Teagasc.With regard <strong>to</strong> digital datasets, satellite images were analysed following the methodology used by O’Loingsigh(2005). Landsat ETM+ imagery was not selected as the landslide mapping dataset due <strong>to</strong> its poor spatialresolution. The EPA/Teagasc DEM with a spatial resolution <strong>of</strong> 20m was used <strong>to</strong> generate aspect and slopemaps for the area. The combination <strong>of</strong> black and white orthopho<strong>to</strong>graphy from 1995 with the DEM using© Fledermaus s<strong>of</strong>tware, for 3D visualisation, was utilized <strong>to</strong> map and classify most <strong>of</strong> the occurrences. Thismethod was compared <strong>to</strong> digital stereopho<strong>to</strong>graphy, which was employed in areas where no other elevationdata was available.5.2.3 MethodologyThe methodology used is based on a literature review and fieldwork experience. The large number <strong>of</strong> eventsmapped dictated which method would be used <strong>to</strong> produce a landslide susceptibility map. It was decided <strong>to</strong> usestatistical analysis on the data acquired. Fig. 5.12 shows a schematic representation <strong>of</strong> the methodologyemployed.Dataset processingFollowing the approach used by O’Loingsigh (2005) Landsat ETM+ imagery was analysed using ERDASs<strong>of</strong>tware. The image was pre-processed in order <strong>to</strong> improve the spatial resolution using the following steps:1. 6 multispectral bands and panchromatic image were re-projected <strong>to</strong> Irish GRID using Nearest Neighbour asthe resampling method.2. Image was resampled <strong>to</strong> 15 metres resolution using a resolution merge method where the panchromaticimage was the high-resolution input file. Principal component analysis was the method utilized, and CubicConvolution was the resampling technique.3. Image was projected with RGB 542.Large landslide scars can be observed in Image 1 (Fig 5.11) displayed in magenta and outlined in green.Comparing this <strong>to</strong> Image 2 (colour orthopho<strong>to</strong> for the same area), it can be observed how some smaller featurescannot be identified in the Landsat image due <strong>to</strong> pixel size or shadow effect (area outlined in blue). Changes invegetation in Image 1 gives the same response – magenta area outlined in red – as landslide scars. This couldlead <strong>to</strong> misinterpretation.Use <strong>of</strong> Landsat imagery can be useful when no other imagery at a higher resolution is available. Due <strong>to</strong>availability <strong>of</strong> colour and black and white orthopho<strong>to</strong>graphy data with a 1 metre spatial resolution for the studyarea, Landsat imagery was discarded as a mapping <strong>to</strong>ol.48