2009 Final Grape Crush Report.pdf - GENCO
2009 Final Grape Crush Report.pdf - GENCO
2009 Final Grape Crush Report.pdf - GENCO

You also want an ePaper? Increase the reach of your titles
YUMPU automatically turns print PDFs into web optimized ePapers that Google loves.
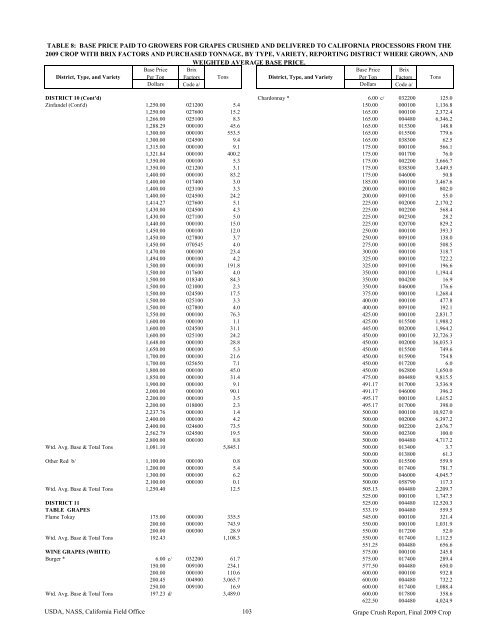
TABLE 8: BASE PRICE PAID TO GROWERS FOR GRAPES CRUSHED AND DELIVERED TO CALIFORNIA PROCESSORS FROM THE<strong>2009</strong> CROP WITH BRIX FACTORS AND PURCHASED TONNAGE, BY TYPE, VARIETY, REPORTING DISTRICT WHERE GROWN, ANDWEIGHTED AVERAGE BASE PRICE.District, Type, and VarietyBase PricePer TonBrixFactors TonsDistrict, Type, and VarietyBase PricePer TonBrixFactors TonsDollars Code a/ Dollars Code a/DISTRICT 10 (Cont'd) Chardonnay * 6.00 c/ 032200 125.0Zinfandel (Cont'd) 1,250.00 021200 5.4 150.00 000100 1,136.81,250.00 027600 15.2 165.00 000100 2,372.41,266.00 025100 8.3 165.00 004480 6,346.21,288.29 000100 45.6 165.00 015300 148.81,300.00 000100 553.5 165.00 015500 779.61,300.00 024500 9.4 165.00 038300 62.51,315.00 000100 9.1 175.00 000100 566.11,321.84 000100 400.2 175.00 001700 76.01,350.00 000100 5.3 175.00 002200 3,666.71,350.00 021200 3.1 175.00 038300 3,449.51,400.00 000100 83.2 175.00 046000 50.81,400.00 017400 3.0 185.00 000100 3,467.61,400.00 023100 3.3 200.00 000100 802.01,400.00 024500 24.2 200.00 009100 55.01,414.27 027600 5.1 225.00 002000 2,170.21,430.00 024500 4.3 225.00 002200 568.41,430.00 027100 5.0 225.00 002300 28.21,440.00 000100 15.0 225.00 020700 829.21,450.00 000100 12.0 250.00 000100 393.31,450.00 027800 3.7 250.00 009100 138.01,450.00 070545 4.0 275.00 000100 508.51,470.00 000100 23.4 300.00 000100 318.71,494.00 000100 4.2 325.00 000100 722.21,500.00 000100 191.8 325.00 009100 196.61,500.00 017600 4.0 350.00 000100 1,194.41,500.00 018340 84.3 350.00 004200 16.91,500.00 021000 2.3 350.00 046000 176.61,500.00 024500 17.5 375.00 000100 1,268.41,500.00 025100 3.3 400.00 000100 477.81,500.00 027800 4.0 400.00 009100 192.11,550.00 000100 76.3 425.00 000100 2,831.71,600.00 000100 1.1 425.00 015500 1,988.21,600.00 024500 31.1 445.00 002000 1,964.21,600.00 025100 24.2 450.00 000100 32,726.31,648.00 000100 28.8 450.00 002000 16,035.31,650.00 000100 5.3 450.00 015500 749.61,700.00 000100 21.6 450.00 015900 754.81,700.00 025650 7.1 450.00 017200 6.01,800.00 000100 45.0 450.00 062800 1,650.01,850.00 000100 31.4 475.00 004480 9,815.51,900.00 000100 9.1 491.17 017000 3,536.92,000.00 000100 90.1 491.17 046000 396.22,200.00 000100 3.5 495.17 000100 1,615.22,200.00 018000 2.3 495.17 017000 398.02,237.76 000100 1.4 500.00 000100 10,927.02,400.00 000100 4.2 500.00 002000 6,397.22,400.00 024600 73.5 500.00 002200 2,676.72,562.79 024500 19.5 500.00 002300 100.02,800.00 000100 8.8 500.00 004480 4,717.2Wtd. Avg. Base & Total Tons 1,081.10 5,845.1 500.00 013400 3.7500.00 013800 61.3Other Red b/ 1,100.00 000100 0.8 500.00 015500 559.91,200.00 000100 5.4 500.00 017400 781.71,300.00 000100 6.2 500.00 046000 4,045.72,100.00 000100 0.1 500.00 058790 117.3Wtd. Avg. Base & Total Tons 1,250.40 12.5 505.13 004480 2,209.7525.00 000100 1,747.5DISTRICT 11 525.00 004480 12,520.3TABLE GRAPES 533.19 004480 559.5Flame Tokay 175.00 000100 335.5 545.00 000100 321.4200.00 000100 743.9 550.00 000100 1,031.9200.00 000300 28.9 550.00 017200 52.0Wtd. Avg. Base & Total Tons 192.43 1,108.3 550.00 017400 1,112.5551.25 004480 656.6WINE GRAPES (WHITE) 575.00 000100 245.8Burger * 6.00 c/ 032200 61.7 575.00 017400 289.4150.00 009100 234.1 577.50 004480 650.0200.00 000100 110.6 600.00 000100 932.8200.45 004900 3,065.7 600.00 004480 732.2250.00 009100 16.9 600.00 017400 1,088.4Wtd. Avg. Base & Total Tons 197.23 d/ 3,489.0 600.00 017800 358.6622.50 004480 4,024.9USDA, NASS, California Field Office 103 <strong>Grape</strong> <strong>Crush</strong> <strong>Report</strong>, <strong>Final</strong> <strong>2009</strong> Crop