2009 Final Grape Crush Report.pdf - GENCO
2009 Final Grape Crush Report.pdf - GENCO
2009 Final Grape Crush Report.pdf - GENCO

You also want an ePaper? Increase the reach of your titles
YUMPU automatically turns print PDFs into web optimized ePapers that Google loves.
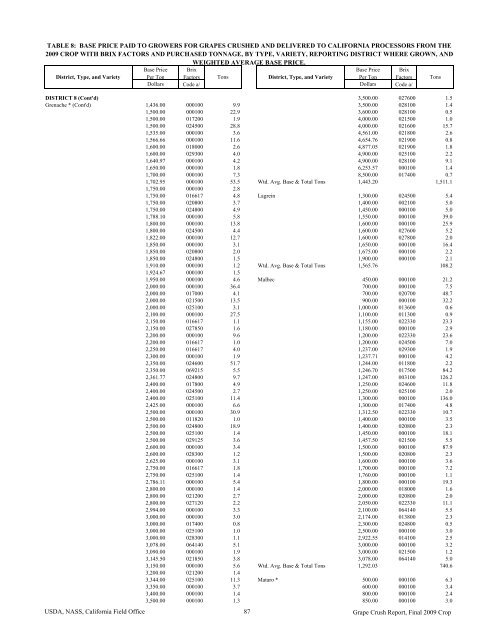
TABLE 8: BASE PRICE PAID TO GROWERS FOR GRAPES CRUSHED AND DELIVERED TO CALIFORNIA PROCESSORS FROM THE<strong>2009</strong> CROP WITH BRIX FACTORS AND PURCHASED TONNAGE, BY TYPE, VARIETY, REPORTING DISTRICT WHERE GROWN, ANDWEIGHTED AVERAGE BASE PRICE.District, Type, and VarietyBase PricePer TonBrixFactors TonsDistrict, Type, and VarietyBase PricePer TonBrixFactors TonsDollars Code a/ Dollars Code a/DISTRICT 8 (Cont'd) 3,500.00 027600 1.5Grenache * (Cont'd) 1,436.00 000100 9.9 3,500.00 028100 1.41,500.00 000100 22.9 3,600.00 028100 0.51,500.00 017200 1.9 4,000.00 021500 1.01,500.00 024500 28.8 4,000.00 021600 15.71,535.00 000100 3.6 4,561.00 021800 2.61,566.66 000100 11.6 4,654.76 021900 0.81,600.00 018000 2.6 4,877.05 021900 1.81,600.00 029300 4.0 4,900.00 025100 2.21,640.97 000100 4.2 4,900.00 028100 9.11,650.00 000100 1.8 6,253.57 000100 1.41,700.00 000100 7.3 8,500.00 017400 0.71,702.95 000100 53.5 Wtd. Avg. Base & Total Tons 1,443.20 1,511.11,750.00 000100 2.81,750.00 016617 4.8 Lagrein 1,300.00 024500 5.41,750.00 020800 3.7 1,400.00 002100 5.01,750.00 024800 4.9 1,450.00 000100 5.01,788.10 000100 5.8 1,550.00 000100 39.01,800.00 000100 13.8 1,600.00 000100 25.91,800.00 024500 4.4 1,600.00 027600 5.21,822.00 000100 12.7 1,600.00 027800 2.01,850.00 000100 3.1 1,650.00 000100 16.41,850.00 020800 2.0 1,675.00 000100 2.21,850.00 024800 1.5 1,900.00 000100 2.11,910.00 000100 1.2 Wtd. Avg. Base & Total Tons 1,565.76 108.21,924.67 000100 1.51,950.00 000100 4.6 Malbec 450.00 000100 21.22,000.00 000100 36.4 700.00 000100 7.52,000.00 017000 4.1 700.00 020700 48.72,000.00 021500 13.5 900.00 000100 32.22,000.00 025100 3.1 1,000.00 013600 0.62,100.00 000100 27.5 1,100.00 011300 0.92,150.00 016617 1.1 1,155.00 022330 23.32,150.00 027850 1.6 1,180.00 000100 2.92,200.00 000100 9.6 1,200.00 022330 23.62,200.00 016617 1.0 1,200.00 024500 7.02,250.00 016617 4.0 1,237.00 029300 1.92,300.00 000100 1.9 1,237.71 000100 4.22,350.00 024600 51.7 1,244.00 011800 2.22,350.00 069215 5.5 1,246.70 017500 84.22,361.77 024800 9.7 1,247.00 003100 126.22,400.00 017800 4.9 1,250.00 024600 11.82,400.00 024500 2.7 1,250.00 025100 2.02,400.00 025100 11.4 1,300.00 000100 136.02,425.00 000100 6.6 1,300.00 017400 4.82,500.00 000100 30.9 1,312.50 022330 10.72,500.00 011820 1.0 1,400.00 000100 3.52,500.00 024800 18.9 1,400.00 020800 2.32,500.00 025100 1.4 1,450.00 000100 18.12,500.00 029125 3.6 1,457.50 021500 5.52,600.00 000100 3.4 1,500.00 000100 87.92,600.00 028300 1.2 1,500.00 020800 2.32,625.00 000100 3.1 1,600.00 000100 3.62,750.00 016617 1.8 1,700.00 000100 7.22,750.00 025100 1.4 1,760.00 000100 1.12,786.11 000100 5.4 1,800.00 000100 19.32,800.00 000100 1.4 2,000.00 018000 1.62,800.00 021200 2.7 2,000.00 020800 2.02,800.00 027120 2.2 2,050.00 022330 11.12,994.00 000100 3.3 2,100.00 064140 5.53,000.00 000100 3.0 2,174.00 013800 2.33,000.00 017400 0.8 2,300.00 024800 0.53,000.00 025100 1.0 2,500.00 000100 3.03,000.00 028300 1.1 2,922.55 014100 2.53,078.00 064140 5.1 3,000.00 000100 3.23,090.00 000100 1.9 3,000.00 021500 1.23,145.50 021850 3.8 3,078.00 064140 5.03,150.00 000100 5.6 Wtd. Avg. Base & Total Tons 1,292.03 740.63,200.00 021200 1.43,344.00 025100 11.3 Mataro * 500.00 000100 6.33,350.00 000100 3.7 600.00 000100 3.43,400.00 000100 1.4 800.00 000100 2.43,500.00 000100 1.3 850.00 000100 3.0USDA, NASS, California Field Office 87 <strong>Grape</strong> <strong>Crush</strong> <strong>Report</strong>, <strong>Final</strong> <strong>2009</strong> Crop