2009 Final Grape Crush Report.pdf - GENCO
2009 Final Grape Crush Report.pdf - GENCO
2009 Final Grape Crush Report.pdf - GENCO

You also want an ePaper? Increase the reach of your titles
YUMPU automatically turns print PDFs into web optimized ePapers that Google loves.
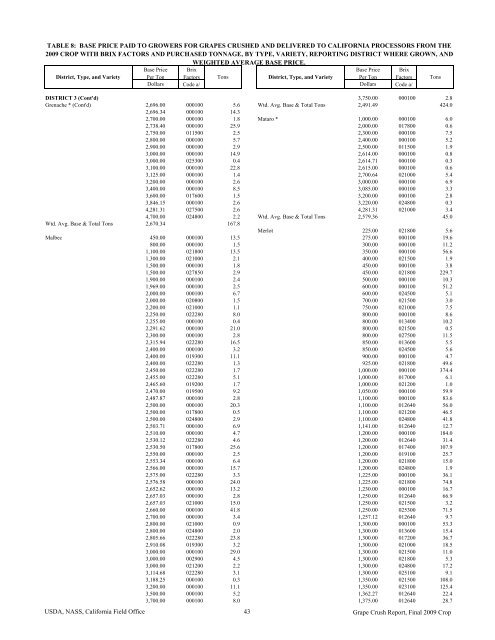
TABLE 8: BASE PRICE PAID TO GROWERS FOR GRAPES CRUSHED AND DELIVERED TO CALIFORNIA PROCESSORS FROM THE<strong>2009</strong> CROP WITH BRIX FACTORS AND PURCHASED TONNAGE, BY TYPE, VARIETY, REPORTING DISTRICT WHERE GROWN, ANDWEIGHTED AVERAGE BASE PRICE.District, Type, and VarietyBase PricePer TonBrixFactors TonsDistrict, Type, and VarietyBase PricePer TonBrixFactors TonsDollars Code a/ Dollars Code a/DISTRICT 3 (Cont'd) 3,750.00 000100 2.8Grenache * (Cont'd) 2,696.00 000100 5.6 Wtd. Avg. Base & Total Tons 2,491.49 424.02,696.34 000100 14.32,700.00 000100 1.8 Mataro * 1,000.00 000100 6.02,738.40 000100 25.9 2,000.00 017800 0.62,750.00 011500 2.5 2,300.00 000100 7.52,800.00 000100 5.7 2,400.00 000100 5.22,900.00 000100 2.9 2,500.00 011500 1.93,000.00 000100 14.9 2,614.00 000100 0.83,000.00 025300 0.4 2,614.71 000100 0.33,100.00 000100 22.8 2,615.00 000100 0.63,125.00 000100 1.4 2,700.64 021000 5.43,200.00 000100 2.6 3,000.00 000100 6.93,400.00 000100 8.5 3,085.00 000100 3.33,600.00 017600 1.5 3,200.00 000100 2.83,846.15 000100 2.6 3,220.00 024800 0.34,281.31 027500 2.6 4,281.31 021000 3.44,700.00 024800 2.2 Wtd. Avg. Base & Total Tons 2,579.36 45.0Wtd. Avg. Base & Total Tons 2,670.34 167.8Merlot 225.00 021800 5.6Malbec 450.00 000100 13.5 275.00 000100 19.6800.00 000100 1.5 300.00 000100 11.21,100.00 021800 13.5 350.00 000100 56.61,300.00 021000 2.1 400.00 021500 1.91,500.00 000100 1.8 450.00 000100 3.81,500.00 027850 2.9 450.00 021800 229.71,900.00 000100 2.4 500.00 000100 10.31,969.00 000100 2.5 600.00 000100 51.22,000.00 000100 6.7 600.00 024500 5.12,000.00 020800 1.5 700.00 021500 3.02,200.00 021000 1.1 750.00 021000 7.52,250.00 022280 8.0 800.00 000100 8.62,255.00 000100 0.4 800.00 013400 10.22,291.62 000100 21.0 800.00 021500 0.52,300.00 000100 2.8 800.00 027500 11.52,315.94 022280 16.5 850.00 013600 5.52,400.00 000100 3.2 850.00 024500 5.62,400.00 019300 11.1 900.00 000100 4.72,400.00 022280 1.3 925.00 021800 49.62,450.00 022280 1.7 1,000.00 000100 374.42,455.00 022280 5.1 1,000.00 017000 6.12,465.60 019200 1.7 1,000.00 021200 1.02,470.00 019500 9.2 1,050.00 000100 59.92,487.87 000100 2.8 1,100.00 000100 83.62,500.00 000100 20.3 1,100.00 012640 56.02,500.00 017800 0.5 1,100.00 021200 46.52,500.00 024800 2.9 1,100.00 024800 41.82,503.71 000100 6.9 1,141.00 012640 12.72,510.00 000100 4.7 1,200.00 000100 184.02,530.12 022280 4.6 1,200.00 012640 31.42,530.50 017800 25.6 1,200.00 017400 107.92,550.00 000100 2.5 1,200.00 019100 25.72,553.34 000100 6.4 1,200.00 021800 15.02,566.00 000100 15.7 1,200.00 024800 1.92,575.00 022280 3.3 1,225.00 000100 36.12,576.58 000100 24.0 1,225.00 021800 74.82,652.62 000100 13.2 1,230.00 000100 16.72,657.03 000100 2.8 1,250.00 012640 66.92,657.03 021000 15.0 1,250.00 021500 3.22,660.00 000100 41.8 1,250.00 025300 71.52,700.00 000100 3.4 1,257.12 012640 9.72,800.00 021000 0.9 1,300.00 000100 53.32,800.00 024800 2.0 1,300.00 013600 15.42,805.66 022280 23.8 1,300.00 017200 36.72,910.08 019300 3.2 1,300.00 021000 18.53,000.00 000100 29.0 1,300.00 021500 11.03,000.00 002900 4.5 1,300.00 021800 5.33,000.00 021200 2.2 1,300.00 024800 17.23,114.68 022280 3.1 1,300.00 025100 9.13,188.25 000100 0.3 1,350.00 021500 108.03,200.00 000100 11.1 1,350.00 023100 125.43,500.00 000100 5.2 1,362.27 012640 22.43,700.00 000100 8.0 1,375.00 012640 28.7USDA, NASS, California Field Office 43 <strong>Grape</strong> <strong>Crush</strong> <strong>Report</strong>, <strong>Final</strong> <strong>2009</strong> Crop