2009 Final Grape Crush Report.pdf - GENCO
2009 Final Grape Crush Report.pdf - GENCO
2009 Final Grape Crush Report.pdf - GENCO

Create successful ePaper yourself
Turn your PDF publications into a flip-book with our unique Google optimized e-Paper software.
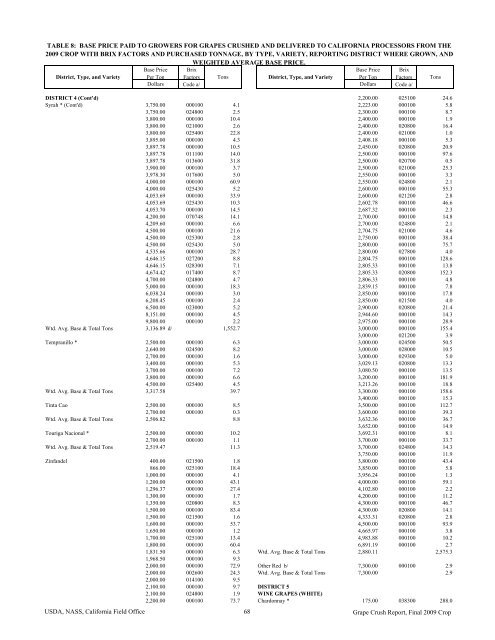
TABLE 8: BASE PRICE PAID TO GROWERS FOR GRAPES CRUSHED AND DELIVERED TO CALIFORNIA PROCESSORS FROM THE<strong>2009</strong> CROP WITH BRIX FACTORS AND PURCHASED TONNAGE, BY TYPE, VARIETY, REPORTING DISTRICT WHERE GROWN, ANDWEIGHTED AVERAGE BASE PRICE.District, Type, and VarietyBase PricePer TonBrixFactors TonsDistrict, Type, and VarietyBase PricePer TonBrixFactors TonsDollars Code a/ Dollars Code a/DISTRICT 4 (Cont'd) 2,200.00 025100 24.6Syrah * (Cont'd) 3,750.00 000100 4.1 2,223.00 000100 5.83,750.00 024800 2.5 2,300.00 000100 8.73,800.00 000100 10.4 2,400.00 000100 1.93,800.00 021000 2.6 2,400.00 020800 16.43,800.00 025400 22.8 2,400.00 021000 1.03,895.00 000100 4.3 2,408.18 000100 5.33,897.78 000100 10.5 2,450.00 020800 20.93,897.78 011100 14.0 2,500.00 000100 97.63,897.78 013600 31.8 2,500.00 020700 0.53,900.00 000100 3.7 2,500.00 021000 25.33,978.30 017600 5.0 2,550.00 000100 3.34,000.00 000100 60.9 2,550.00 024800 2.14,000.00 025430 5.2 2,600.00 000100 55.34,053.69 000100 33.9 2,600.00 021200 2.84,053.69 025430 10.3 2,602.78 000100 46.64,053.70 000100 14.5 2,687.32 000100 2.34,200.00 070748 14.1 2,700.00 000100 14.84,209.60 000100 6.6 2,700.00 024800 2.14,500.00 000100 21.6 2,704.75 021000 4.64,500.00 025300 2.8 2,750.00 000100 38.44,500.00 025430 5.0 2,800.00 000100 75.74,535.66 000100 28.7 2,800.00 027800 4.04,646.15 027200 8.8 2,804.75 000100 128.64,646.15 028300 7.1 2,805.33 000100 13.84,674.42 017400 8.7 2,805.33 020800 152.34,700.00 024800 4.7 2,806.33 000100 4.85,000.00 000100 18.3 2,839.15 000100 7.86,038.24 000100 3.0 2,850.00 000100 17.86,208.45 000100 2.4 2,850.00 021500 4.06,500.00 023000 5.2 2,900.00 020800 21.48,151.00 000100 4.5 2,944.60 000100 14.39,800.00 000100 2.2 2,975.00 000100 28.9Wtd. Avg. Base & Total Tons 3,136.89 d/ 1,552.7 3,000.00 000100 155.43,000.00 021200 3.9Tempranillo * 2,500.00 000100 6.3 3,000.00 024500 50.52,640.00 024500 8.2 3,000.00 028000 10.52,700.00 000100 1.6 3,000.00 029300 5.03,400.00 000100 5.3 3,029.13 020800 13.33,700.00 000100 7.2 3,080.50 000100 13.53,800.00 000100 6.6 3,200.00 000100 181.94,500.00 025400 4.5 3,213.26 000100 18.8Wtd. Avg. Base & Total Tons 3,317.58 39.7 3,300.00 000100 158.63,400.00 000100 15.3Tinta Cao 2,500.00 000100 8.5 3,500.00 000100 112.72,700.00 000100 0.3 3,600.00 000100 39.3Wtd. Avg. Base & Total Tons 2,506.82 8.8 3,632.36 000100 36.73,652.00 000100 14.9Touriga Nacional * 2,500.00 000100 10.2 3,692.31 000100 8.12,700.00 000100 1.1 3,700.00 000100 33.7Wtd. Avg. Base & Total Tons 2,519.47 11.3 3,700.00 024800 14.33,750.00 000100 11.9Zinfandel 400.00 021500 1.8 3,800.00 000100 43.4866.00 025100 18.4 3,850.00 000100 5.81,000.00 000100 4.1 3,956.24 000100 1.31,200.00 000100 43.1 4,000.00 000100 59.11,296.37 000100 27.4 4,102.80 000100 2.21,300.00 000100 1.7 4,200.00 000100 11.21,350.00 020800 8.3 4,300.00 000100 46.71,500.00 000100 83.4 4,300.00 020800 14.11,500.00 021500 1.6 4,333.31 020800 2.81,600.00 000100 53.7 4,500.00 000100 93.91,650.00 000100 1.2 4,665.97 000100 3.81,700.00 025100 13.4 4,983.88 000100 10.21,800.00 000100 60.4 6,891.19 000100 2.71,831.50 000100 6.3 Wtd. Avg. Base & Total Tons 2,880.11 2,575.31,968.50 000100 9.32,000.00 000100 72.9 Other Red b/ 7,300.00 000100 2.92,000.00 002600 24.3 Wtd. Avg. Base & Total Tons 7,300.00 2.92,000.00 014100 9.52,100.00 000100 9.7 DISTRICT 52,100.00 024800 1.9 WINE GRAPES (WHITE)2,200.00 000100 73.7 Chardonnay * 175.00 038300 288.0USDA, NASS, California Field Office 68 <strong>Grape</strong> <strong>Crush</strong> <strong>Report</strong>, <strong>Final</strong> <strong>2009</strong> Crop