2009 Final Grape Crush Report.pdf - GENCO
2009 Final Grape Crush Report.pdf - GENCO
2009 Final Grape Crush Report.pdf - GENCO

Create successful ePaper yourself
Turn your PDF publications into a flip-book with our unique Google optimized e-Paper software.
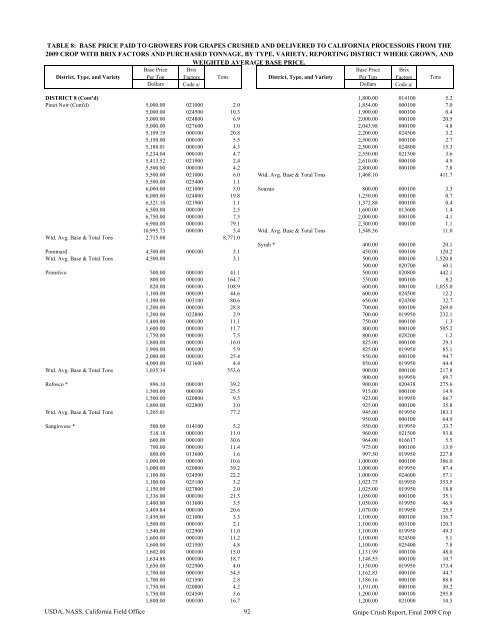
TABLE 8: BASE PRICE PAID TO GROWERS FOR GRAPES CRUSHED AND DELIVERED TO CALIFORNIA PROCESSORS FROM THE<strong>2009</strong> CROP WITH BRIX FACTORS AND PURCHASED TONNAGE, BY TYPE, VARIETY, REPORTING DISTRICT WHERE GROWN, ANDWEIGHTED AVERAGE BASE PRICE.District, Type, and VarietyBase PricePer TonBrixFactors TonsDistrict, Type, and VarietyBase PricePer TonBrixFactors TonsDollars Code a/ Dollars Code a/DISTRICT 8 (Cont'd) 1,800.00 014100 5.2Pinot Noir (Cont'd) 5,000.00 021000 2.0 1,854.00 000100 7.05,000.00 024500 10.3 1,900.00 000100 0.45,000.00 024800 6.9 2,000.00 000100 20.55,000.00 027600 1.0 2,043.98 000100 4.85,109.19 000100 20.8 2,200.00 024500 3.25,150.00 000100 5.5 2,500.00 000100 2.75,188.01 000100 4.3 2,500.00 024800 15.35,234.04 000100 4.7 2,550.00 021500 3.65,413.52 021900 2.4 2,610.00 000100 4.95,500.00 000100 4.2 2,800.00 000100 7.85,500.00 021000 6.0 Wtd. Avg. Base & Total Tons 1,468.10 411.75,500.00 025400 1.16,000.00 021000 5.0 Souzao 800.00 000100 3.36,000.00 024800 19.8 1,250.00 000100 0.76,321.10 021900 1.1 1,372.88 000100 0.46,500.00 000100 2.5 1,600.00 013600 1.46,750.00 000100 7.5 2,000.00 000100 4.16,900.00 000100 79.1 2,300.00 000100 1.110,995.73 000100 5.4 Wtd. Avg. Base & Total Tons 1,548.56 11.0Wtd. Avg. Base & Total Tons 2,715.08 8,771.0Syrah * 400.00 000100 20.1Pommard 4,500.00 000100 3.1 450.00 000100 120.2Wtd. Avg. Base & Total Tons 4,500.00 3.1 500.00 000100 1,520.8500.00 020700 60.1Primitivo 500.00 000100 41.1 500.00 020800 442.1800.00 000100 164.7 550.00 000100 8.2820.00 000100 108.9 600.00 000100 1,055.01,100.00 000100 44.6 600.00 024500 12.21,100.00 003100 80.6 650.00 024300 32.71,200.00 000100 28.8 700.00 000100 269.01,200.00 022800 2.9 700.00 019950 232.11,400.00 000100 11.1 750.00 000100 1.31,600.00 000100 11.7 800.00 000100 505.21,750.00 000100 7.5 800.00 028200 1.21,800.00 000100 16.0 825.00 000100 29.31,900.00 000100 5.9 825.00 019950 85.12,000.00 000100 25.4 850.00 000100 94.74,000.00 021600 4.4 850.00 019950 44.4Wtd. Avg. Base & Total Tons 1,035.34 553.6 900.00 000100 217.8900.00 019950 69.7Refosco * 896.10 000100 39.2 900.00 020438 275.61,500.00 000100 25.5 915.00 000100 14.91,500.00 020800 9.5 923.00 019950 66.71,800.00 022800 3.0 925.00 000100 35.8Wtd. Avg. Base & Total Tons 1,205.01 77.2 945.00 019950 183.3950.00 000100 64.9Sangiovese * 500.00 014100 5.2 950.00 019950 33.7518.18 000100 11.0 960.00 021500 93.8600.00 000100 30.6 964.00 016617 5.5700.00 000100 11.4 975.00 000100 13.0800.00 013600 1.6 997.50 019950 227.81,000.00 000100 10.6 1,000.00 000100 386.01,000.00 020800 39.2 1,000.00 019950 87.41,100.00 024500 22.2 1,000.00 024600 57.11,100.00 025100 3.2 1,023.75 019950 353.51,150.00 027800 2.0 1,025.00 019950 18.81,336.00 000100 21.3 1,050.00 000100 35.11,400.00 013600 3.5 1,050.00 019950 46.91,409.84 000100 20.6 1,070.00 019950 25.51,450.00 021000 3.3 1,100.00 000100 136.71,500.00 000100 2.1 1,100.00 003100 120.31,540.00 022900 11.0 1,100.00 019950 49.31,600.00 000100 11.2 1,100.00 024500 5.11,600.00 021500 4.8 1,100.00 025400 7.81,602.00 000100 15.0 1,131.99 000100 48.01,634.88 000100 18.7 1,148.55 000100 10.71,650.00 022900 4.0 1,150.00 019950 173.41,700.00 000100 54.5 1,162.83 000100 44.71,700.00 021500 2.8 1,186.16 000100 88.81,750.00 020800 4.2 1,191.00 000100 30.21,750.00 024500 5.6 1,200.00 000100 295.81,800.00 000100 16.7 1,200.00 021000 10.5USDA, NASS, California Field Office 92 <strong>Grape</strong> <strong>Crush</strong> <strong>Report</strong>, <strong>Final</strong> <strong>2009</strong> Crop