2009 Final Grape Crush Report.pdf - GENCO
2009 Final Grape Crush Report.pdf - GENCO
2009 Final Grape Crush Report.pdf - GENCO

You also want an ePaper? Increase the reach of your titles
YUMPU automatically turns print PDFs into web optimized ePapers that Google loves.
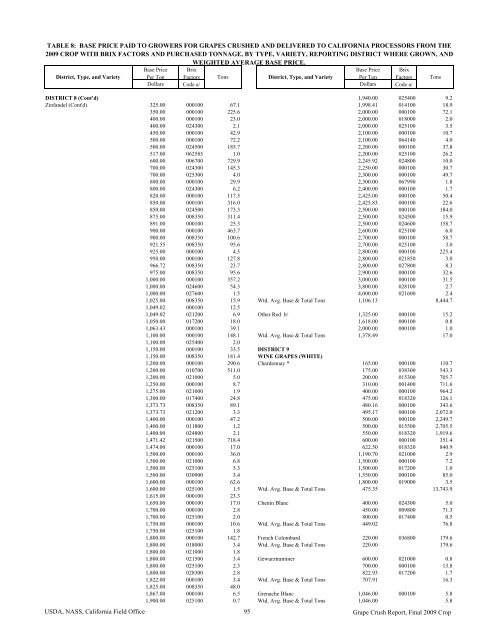
TABLE 8: BASE PRICE PAID TO GROWERS FOR GRAPES CRUSHED AND DELIVERED TO CALIFORNIA PROCESSORS FROM THE<strong>2009</strong> CROP WITH BRIX FACTORS AND PURCHASED TONNAGE, BY TYPE, VARIETY, REPORTING DISTRICT WHERE GROWN, ANDWEIGHTED AVERAGE BASE PRICE.District, Type, and VarietyBase PricePer TonBrixFactors TonsDistrict, Type, and VarietyBase PricePer TonBrixFactors TonsDollars Code a/ Dollars Code a/DISTRICT 8 (Cont'd) 1,940.00 025400 9.2Zinfandel (Cont'd) 325.00 000100 67.1 1,998.41 014100 18.9350.00 000100 225.6 2,000.00 000100 72.1400.00 000100 23.0 2,000.00 018000 2.0400.00 024300 2.1 2,000.00 025100 3.5450.00 000100 42.9 2,100.00 000100 10.7500.00 000100 72.2 2,100.00 064140 4.0500.00 024500 185.7 2,200.00 000100 37.8517.00 062585 1.0 2,200.00 025100 26.2600.00 006700 729.9 2,245.92 024800 10.0700.00 024300 145.3 2,250.00 000100 30.7700.00 025300 4.0 2,300.00 000100 49.7800.00 000100 29.9 2,300.00 067990 1.8800.00 024300 6.2 2,400.00 000100 1.7820.00 000100 117.5 2,425.00 000100 50.4850.00 000100 316.0 2,425.83 000100 22.6850.00 024500 173.3 2,500.00 000100 184.0875.00 008350 311.4 2,500.00 024500 15.9891.00 000100 25.3 2,500.00 024600 158.7900.00 000100 463.7 2,600.00 025100 6.0900.00 008350 100.6 2,700.00 000100 58.7921.55 008350 95.6 2,700.00 025100 3.0925.00 000100 4.5 2,800.00 000100 225.4950.00 000100 127.8 2,800.00 021850 3.0966.72 008350 23.7 2,800.00 027800 8.3975.00 008350 95.6 2,900.00 000100 32.61,000.00 000100 357.2 3,000.00 000100 31.51,000.00 024600 54.3 3,800.00 028100 2.71,000.00 027600 1.5 4,000.00 021600 2.41,025.00 008350 15.9 Wtd. Avg. Base & Total Tons 1,106.13 8,444.71,049.02 000100 12.51,049.02 021200 6.9 Other Red b/ 1,325.00 000100 15.21,050.00 017200 18.0 1,618.00 000100 0.81,063.43 000100 39.1 2,000.00 000100 1.01,100.00 000100 148.1 Wtd. Avg. Base & Total Tons 1,378.49 17.01,100.00 025400 2.01,150.00 000100 33.5 DISTRICT 91,150.00 008350 181.4 WINE GRAPES (WHITE)1,200.00 000100 290.6 Chardonnay * 165.00 000100 110.71,200.00 010700 511.0 175.00 038300 543.31,200.00 021000 5.0 200.00 015300 705.71,250.00 000100 8.7 310.00 001400 711.61,275.00 021000 1.9 400.00 000100 964.21,300.00 017400 24.8 475.00 018320 126.11,373.73 008350 89.1 480.16 000100 343.61,373.73 021200 3.3 495.17 000100 2,072.01,400.00 000100 47.2 500.00 000100 2,249.71,400.00 011800 1.2 500.00 015500 2,705.51,400.00 024800 2.1 550.00 018320 1,919.61,471.42 021500 718.4 600.00 000100 351.41,474.00 000100 17.0 622.50 018320 840.91,500.00 000100 36.0 1,190.70 021000 2.91,500.00 021000 6.8 1,500.00 000100 7.21,500.00 025100 5.3 1,500.00 017200 1.01,500.00 030900 3.4 1,550.00 000100 85.01,600.00 000100 62.6 1,800.00 019000 3.51,600.00 025100 1.5 Wtd. Avg. Base & Total Tons 475.35 13,743.91,615.00 000100 23.31,650.00 000100 17.0 Chenin Blanc 400.00 024300 5.01,700.00 000100 2.8 450.00 009800 71.31,700.00 025100 2.0 800.00 017400 0.51,750.00 000100 10.6 Wtd. Avg. Base & Total Tons 449.02 76.81,750.00 025100 1.81,800.00 000100 142.7 French Colombard 220.00 036800 179.61,800.00 018000 3.4 Wtd. Avg. Base & Total Tons 220.00 179.61,800.00 021000 1.81,800.00 021500 3.4 Gewurztraminer 600.00 021000 0.81,800.00 025100 2.3 700.00 000100 13.81,800.00 028300 2.8 822.93 017200 1.71,822.00 000100 3.4 Wtd. Avg. Base & Total Tons 707.91 16.31,825.00 008350 48.01,867.00 000100 6.5 Grenache Blanc 1,046.00 000100 5.81,900.00 025100 0.7 Wtd. Avg. Base & Total Tons 1,046.00 5.8USDA, NASS, California Field Office 95 <strong>Grape</strong> <strong>Crush</strong> <strong>Report</strong>, <strong>Final</strong> <strong>2009</strong> Crop