2009 Final Grape Crush Report.pdf - GENCO
2009 Final Grape Crush Report.pdf - GENCO
2009 Final Grape Crush Report.pdf - GENCO

You also want an ePaper? Increase the reach of your titles
YUMPU automatically turns print PDFs into web optimized ePapers that Google loves.
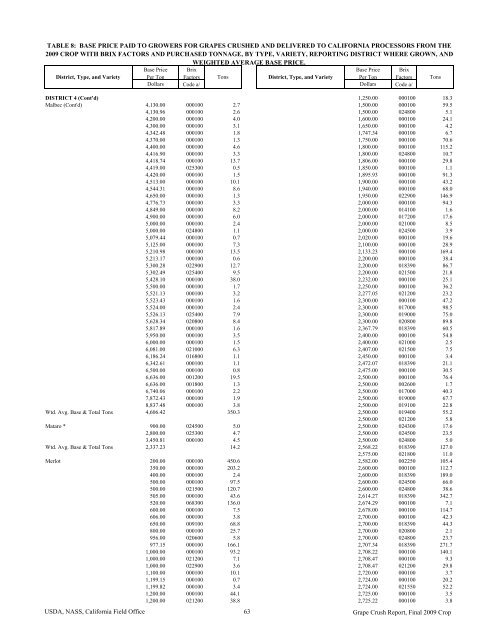
TABLE 8: BASE PRICE PAID TO GROWERS FOR GRAPES CRUSHED AND DELIVERED TO CALIFORNIA PROCESSORS FROM THE<strong>2009</strong> CROP WITH BRIX FACTORS AND PURCHASED TONNAGE, BY TYPE, VARIETY, REPORTING DISTRICT WHERE GROWN, ANDWEIGHTED AVERAGE BASE PRICE.District, Type, and VarietyBase PricePer TonBrixFactors TonsDistrict, Type, and VarietyBase PricePer TonBrixFactors TonsDollars Code a/ Dollars Code a/DISTRICT 4 (Cont'd) 1,250.00 000100 18.3Malbec (Cont'd) 4,130.00 000100 2.7 1,500.00 000100 59.54,130.96 000100 2.6 1,500.00 024800 5.14,200.00 000100 4.0 1,600.00 000100 24.14,300.00 000100 3.1 1,650.00 000100 4.24,342.48 000100 1.8 1,747.34 000100 6.74,370.00 000100 1.3 1,750.00 000100 70.64,400.00 000100 4.6 1,800.00 000100 115.24,416.90 000100 3.3 1,800.00 024800 10.74,418.74 000100 13.7 1,806.00 000100 29.84,419.00 025300 0.5 1,850.00 000100 1.14,420.00 000100 1.5 1,895.93 000100 91.34,513.00 000100 10.1 1,900.00 000100 43.24,544.31 000100 8.6 1,940.00 000100 68.04,650.00 000100 1.3 1,950.00 022900 146.94,776.73 000100 3.3 2,000.00 000100 94.34,849.00 000100 8.2 2,000.00 014100 1.64,900.00 000100 6.0 2,000.00 017200 17.65,000.00 000100 2.4 2,000.00 021000 8.55,000.00 024800 1.1 2,000.00 024500 3.95,079.44 000100 0.7 2,020.00 000100 19.65,125.00 000100 7.3 2,100.00 000100 28.95,210.98 000100 13.5 2,133.23 000100 169.45,213.17 000100 0.6 2,200.00 000100 38.45,300.28 022900 12.7 2,200.00 018390 86.75,302.49 025400 9.5 2,200.00 021500 21.85,428.10 000100 38.0 2,232.00 000100 25.15,500.00 000100 1.7 2,250.00 000100 36.25,521.13 000100 3.2 2,277.05 021200 23.25,523.43 000100 1.6 2,300.00 000100 47.25,524.00 000100 2.4 2,300.00 017000 98.55,526.13 025400 7.9 2,300.00 019000 75.05,628.34 020800 8.4 2,300.00 020800 89.85,817.89 000100 1.6 2,367.79 018390 60.55,950.00 000100 3.5 2,400.00 000100 54.86,000.00 000100 1.5 2,400.00 021000 2.56,081.00 021000 6.3 2,407.00 021500 7.56,186.24 016800 1.1 2,450.00 000100 3.46,342.61 000100 1.1 2,472.07 018390 21.16,500.00 000100 0.8 2,475.00 000100 30.56,636.00 001200 19.5 2,500.00 000100 76.46,636.00 001800 1.3 2,500.00 002600 1.76,740.06 000100 2.2 2,500.00 017000 40.37,872.43 000100 1.9 2,500.00 019000 67.78,837.48 000100 3.8 2,500.00 019100 22.8Wtd. Avg. Base & Total Tons 4,606.42 350.3 2,500.00 019400 55.22,500.00 021200 5.8Mataro * 900.00 024500 5.0 2,500.00 024300 17.62,800.00 025300 4.7 2,500.00 024500 23.53,450.81 000100 4.5 2,500.00 024800 5.0Wtd. Avg. Base & Total Tons 2,337.23 14.2 2,568.22 018390 127.02,575.00 021800 11.0Merlot 200.00 000100 450.6 2,582.00 002250 105.4350.00 000100 203.2 2,600.00 000100 112.7400.00 000100 2.4 2,600.00 018390 189.0500.00 000100 97.5 2,600.00 024500 66.0500.00 021500 120.7 2,600.00 024800 38.6505.00 000100 43.6 2,614.27 018390 342.7520.00 068300 136.0 2,674.29 000100 7.1600.00 000100 7.5 2,678.00 000100 114.7606.00 000100 3.8 2,700.00 000100 42.3650.00 009100 68.8 2,700.00 018390 44.3800.00 000100 25.7 2,700.00 020800 2.1956.00 020600 5.8 2,700.00 024800 23.7977.15 000100 166.1 2,707.34 018390 271.71,000.00 000100 93.2 2,708.22 000100 140.11,000.00 021200 7.1 2,708.47 000100 9.31,000.00 022900 3.6 2,708.47 021200 29.81,100.00 000100 10.1 2,720.00 000100 3.71,199.15 000100 0.7 2,724.00 000100 20.21,199.82 000100 3.4 2,724.00 021550 52.21,200.00 000100 44.1 2,725.00 000100 3.51,200.00 021200 38.8 2,725.22 000100 3.8USDA, NASS, California Field Office 63 <strong>Grape</strong> <strong>Crush</strong> <strong>Report</strong>, <strong>Final</strong> <strong>2009</strong> Crop