2009 Final Grape Crush Report.pdf - GENCO
2009 Final Grape Crush Report.pdf - GENCO
2009 Final Grape Crush Report.pdf - GENCO

Create successful ePaper yourself
Turn your PDF publications into a flip-book with our unique Google optimized e-Paper software.
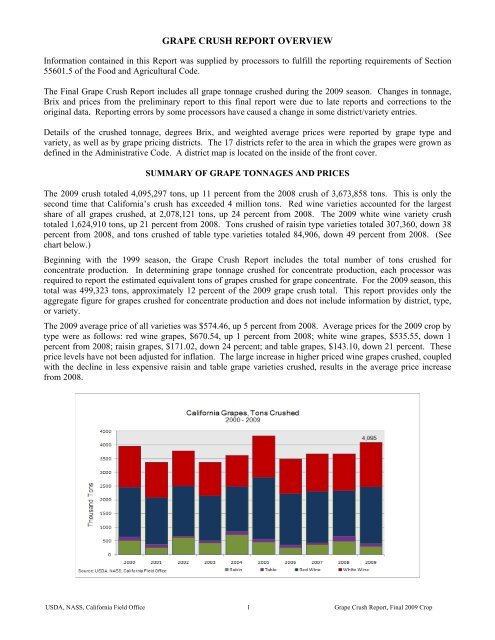
GRAPE CRUSH REPORT OVERVIEWInformation contained in this <strong>Report</strong> was supplied by processors to fulfill the reporting requirements of Section55601.5 of the Food and Agricultural Code.The <strong>Final</strong> <strong>Grape</strong> <strong>Crush</strong> <strong>Report</strong> includes all grape tonnage crushed during the <strong>2009</strong> season. Changes in tonnage,Brix and prices from the preliminary report to this final report were due to late reports and corrections to theoriginal data. <strong>Report</strong>ing errors by some processors have caused a change in some district/variety entries.Details of the crushed tonnage, degrees Brix, and weighted average prices were reported by grape type andvariety, as well as by grape pricing districts. The 17 districts refer to the area in which the grapes were grown asdefined in the Administrative Code. A district map is located on the inside of the front cover.SUMMARY OF GRAPE TONNAGES AND PRICESThe <strong>2009</strong> crush totaled 4,095,297 tons, up 11 percent from the 2008 crush of 3,673,858 tons. This is only thesecond time that California’s crush has exceeded 4 million tons. Red wine varieties accounted for the largestshare of all grapes crushed, at 2,078,121 tons, up 24 percent from 2008. The <strong>2009</strong> white wine variety crushtotaled 1,624,910 tons, up 21 percent from 2008. Tons crushed of raisin type varieties totaled 307,360, down 38percent from 2008, and tons crushed of table type varieties totaled 84,906, down 49 percent from 2008. (Seechart below.)Beginning with the 1999 season, the <strong>Grape</strong> <strong>Crush</strong> <strong>Report</strong> includes the total number of tons crushed forconcentrate production. In determining grape tonnage crushed for concentrate production, each processor wasrequired to report the estimated equivalent tons of grapes crushed for grape concentrate. For the <strong>2009</strong> season, thistotal was 499,323 tons, approximately 12 percent of the <strong>2009</strong> grape crush total. This report provides only theaggregate figure for grapes crushed for concentrate production and does not include information by district, type,or variety.The <strong>2009</strong> average price of all varieties was $574.46, up 5 percent from 2008. Average prices for the <strong>2009</strong> crop bytype were as follows: red wine grapes, $670.54, up 1 percent from 2008; white wine grapes, $535.55, down 1percent from 2008; raisin grapes, $171.02, down 24 percent; and table grapes, $143.10, down 21 percent. Theseprice levels have not been adjusted for inflation. The large increase in higher priced wine grapes crushed, coupledwith the decline in less expensive raisin and table grape varieties crushed, results in the average price increasefrom 2008.USDA, NASS, California Field Office 1 <strong>Grape</strong> <strong>Crush</strong> <strong>Report</strong>, <strong>Final</strong> <strong>2009</strong> Crop