Central zone (56 percent) has the highest proportion of male in-migrants of all of the zones of the country.Among the regions, nearly two-fifths of male in-migrants live in the Capital region of the country,whereas only 2 percent of male in-migrants live in the Central Highland region of the country. Of note isthat over two-fifths (42 percent) of male in-migrants are in the highest wealth quintile. There is littledifference in the percent distribution of male in-migrants by remoteness quintile.It is interesting to note that there are more adult male than female out-migrants but many moreadult female in-migrants. The data also show that among female in-migrants, more than two-thirds (70percent) changed residence during their early reproductive years, that is, at age 15-29. Female in-migrantswere most often in rural areas (64 percent) and the Central zone (47 percent). Among the regions of thecountry, over one-quarter (28 percent) of female in-migrants were found in the Capital region, whereasonly 3 percent of female in-migrants were in the Central Highland region of the country. In addition,nearly one-third (31 percent) of female in-migrants are in the highest wealth quintile. In contrast, only 13percent of female in-migrants are in the lowest wealth quintile. Nearly one in four female in-migrants is inthe second most remote quintile, with in-migrants least likely to be in the least remote quintile.Table 2.11 Household in-migrants by background characteristicsPercent distribution of in-migrants age 15 years and older to households in the five years preceding the survey,according to background characteristics, by sex, <strong>Afghanistan</strong> <strong>2010</strong>SexBackgroundFemale Male Totalcharacteristic Percent Number Percent Number Percent NumberAge at time of migration15-19 42.4 3,715 18.6 955 33.6 4,67020-24 19.5 1,709 15.0 768 17.8 2,47725-29 8.5 747 13.1 674 10.2 1,42130-34 5.1 446 10.2 521 7.0 96735-39 4.3 377 8.9 455 6.0 83340-44 2.9 256 6.4 327 4.2 58345-49 2.2 197 5.9 301 3.6 49850 8.3 729 14.4 736 10.5 1,465Don’t know/missing 6.8 594 7.6 389 7.1 983ResidenceUrban 36.1 3,164 52.9 2,711 42.3 5,875Rural 63.9 5,605 47.1 2,415 57.7 8,021ZoneNorth 24.1 2,115 20.7 1,059 22.8 3,174Central 46.5 4,079 56.4 2,891 50.2 6,970South 29.4 2,575 22.9 1,176 27.0 3,751RegionNorth Eastern 10.3 899 7.0 357 9.0 1,256Northern 13.9 1,216 13.7 702 13.8 1,918Western 15.1 1,327 13.7 704 14.6 2,031Central Highland 2.9 257 2.4 124 2.7 381Capital 28.4 2,494 40.3 2,063 32.8 4,558Eastern 13.1 1,147 13.1 669 13.1 1,816Southern 6.0 524 4.4 227 5.4 750South Eastern 10.3 905 5.5 280 8.5 1,184Wealth quintileLowest 13.3 1,170 10.3 526 12.2 1,695Second 18.0 1,575 12.7 650 16.0 2,225Middle 17.9 1,574 15.8 808 17.1 2,382Fourth 19.5 1,710 19.3 988 19.4 2,699Highest 31.2 2,740 42.0 2,154 35.2 4,895Remoteness quintileMost remote 22.7 1,991 19.6 1,005 21.6 2,996Second 24.7 2,166 19.9 1,022 22.9 3,188Middle 20.9 1,830 21.9 1,125 21.3 2,955Fourth 17.4 1,527 19.9 1,023 18.3 2,549Least remote 14.3 1,256 18.5 951 15.9 2,206Total 100.0 8,769 100.0 5,126 100.0 13,89532 | Household Population, Household and Women’s Characteristics
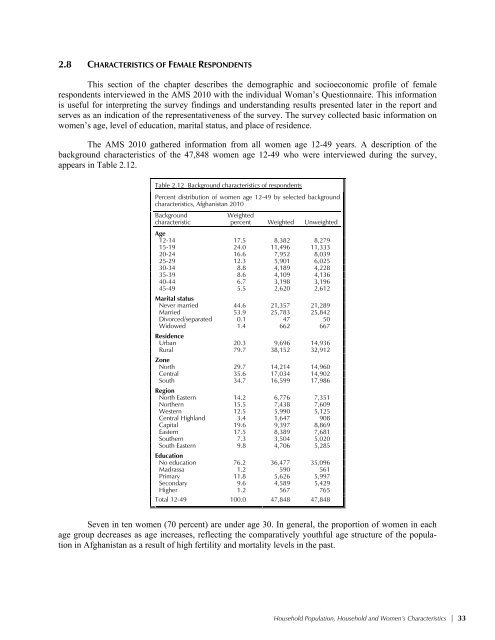
2.8 CHARACTERISTICS OF FEMALE RESPONDENTSThis section of the chapter describes the demographic and socioeconomic profile of femalerespondents interviewed in the AMS <strong>2010</strong> with the individual Woman’s Questionnaire. This informationis useful for interpreting the survey findings and understanding results presented later in the report andserves as an indication of the representativeness of the survey. The survey collected basic information onwomen’s age, level of education, marital status, and place of residence.The AMS <strong>2010</strong> gathered information from all women age 12-49 years. A description of thebackground characteristics of the 47,848 women age 12-49 who were interviewed during the survey,appears in Table 2.12.Table 2.12 Background characteristics of respondentsPercent distribution of women age 12-49 by selected backgroundcharacteristics, <strong>Afghanistan</strong> <strong>2010</strong>BackgroundcharacteristicWeightedpercent Weighted UnweightedAge12-14 17.5 8,382 8,27915-19 24.0 11,496 11,33320-24 16.6 7,952 8,03925-29 12.3 5,901 6,02530-34 8.8 4,189 4,22835-39 8.6 4,109 4,13640-44 6.7 3,198 3,19645-49 5.5 2,620 2,612Marital statusNever married 44.6 21,357 21,289Married 53.9 25,783 25,842Divorced/separated 0.1 47 50Widowed 1.4 662 667ResidenceUrban 20.3 9,696 14,936Rural 79.7 38,152 32,912ZoneNorth 29.7 14,214 14,960Central 35.6 17,034 14,902South 34.7 16,599 17,986RegionNorth Eastern 14.2 6,776 7,351Northern 15.5 7,438 7,609Western 12.5 5,990 5,125Central Highland 3.4 1,647 908Capital 19.6 9,397 8,869Eastern 17.5 8,389 7,681Southern 7.3 3,504 5,020South Eastern 9.8 4,706 5,285EducationNo education 76.2 36,477 35,096Madrassa 1.2 590 561Primary 11.8 5,626 5,997Secondary 9.6 4,589 5,429Higher 1.2 567 765Total 12-49 100.0 47,848 47,848Seven in ten women (70 percent) are under age 30. In general, the proportion of women in eachage group decreases as age increases, reflecting the comparatively youthful age structure of the populationin <strong>Afghanistan</strong> as a result of high fertility and mortality levels in the past.Household Population, Household and Women’s Characteristics | 33
- Page 1:
AfghanistanMortality Survey 2010
- Page 5 and 6: CONTENTSTABLES AND FIGURES ........
- Page 7 and 8: 4.3 Postnatal Care.................
- Page 9 and 10: TABLES AND FIGURESCHAPTER 1INTRODUC
- Page 11 and 12: Table 5.2 Early childhood mortality
- Page 13: APPENDIX CDATA QUALITY TABLESTable
- Page 17: AMS 2010 TECHNICAL ADVISORY GROUP M
- Page 21 and 22: AMS 2010 CONTRIBUTORS TO THE REPORT
- Page 23 and 24: INTRODUCTION 11.1 GEOGRAPHY, HISTOR
- Page 25 and 26: After the fall of the communist reg
- Page 27 and 28: Afghanistan, in cooperation with th
- Page 29 and 30: workload of the BHC, up to two addi
- Page 31 and 32: complete list of names of persons i
- Page 33 and 34: 1.7 QUESTIONNAIRESFour questionnair
- Page 35 and 36: survey, a detailed review of the qu
- Page 37 and 38: 1.10 RESPONSE RATESTable 1.2 shows
- Page 39: 72 percent of the rural population
- Page 42 and 43: Figure 2.1 Population Pyramid80 +75
- Page 44 and 45: Table 2.3 Children’s orphanhood s
- Page 46 and 47: Table 2.5 presents information on h
- Page 48 and 49: Table 2.7 Household possessionsPerc
- Page 50 and 51: emoteness, and the scores were summ
- Page 52 and 53: The analysis also suggests that amo
- Page 56 and 57: The data also show that more than h
- Page 58 and 59: 2.10 CONCLUSIONThe AMS 2010 enumera
- Page 60 and 61: 3.1.2 Data Quality AssessmentThe pr
- Page 62 and 63: more problematic for the estimates
- Page 64 and 65: Table 3.2 Fertility by background c
- Page 66 and 67: Another frequently used approach to
- Page 68 and 69: 3.2.6 Birth IntervalsA birth interv
- Page 70 and 71: 3.2.7 Age at First BirthThe onset o
- Page 72 and 73: Table 3.9 Teenage pregnancy and mot
- Page 74 and 75: Table 3.11 Age at first marriagePer
- Page 76 and 77: the community level by utilizing al
- Page 78 and 79: difference may be due to difference
- Page 80 and 81: There are substantial differences i
- Page 82 and 83: Table 3.17 Total fertility rate and
- Page 85 and 86: MATERNAL HEALTH 4Afghanistan is com
- Page 87 and 88: Table 4.1 Antenatal carePercent dis
- Page 89 and 90: Figure 4.2 Trends in Antenatal Care
- Page 91 and 92: 4.1.3 Problems with Pregnancy at Fi
- Page 93 and 94: 4.1.4 Number and Timing of Antenata
- Page 95 and 96: About one-third (32 percent) of mot
- Page 97 and 98: As with other maternal health indic
- Page 99 and 100: Table 4.8 Reasons for not deliverin
- Page 101 and 102: Table 4.9 Assistance during deliver
- Page 103 and 104: 4.2.4 Procedures Performed at Deliv
- Page 105 and 106:
Figure 4.6 Reasons for Not Seeking
- Page 107 and 108:
Table 4.12 presents information on
- Page 109 and 110:
Table 4.13 Problems in accessing he
- Page 111 and 112:
INFANT AND CHILD MORTALITY 5Early c
- Page 113 and 114:
first seven days of life, to estima
- Page 115 and 116:
In considering the mortality trends
- Page 117 and 118:
data was found in Afghanistan exclu
- Page 119 and 120:
Central zone and 32 percent in the
- Page 121 and 122:
Table 5.4 Early childhood mortality
- Page 123 and 124:
The patterns of perinatal mortality
- Page 125:
problem for areas outside the South
- Page 128 and 129:
information was usually reported by
- Page 130 and 131:
fallen from 118 deaths to 71 deaths
- Page 132 and 133:
Table 6.4 shows adult mortality rat
- Page 134 and 135:
mortality levels. The procedures us
- Page 136 and 137:
Table 6.6 Female and male life tabl
- Page 138 and 139:
Table 6.7 Mean sibship size and sex
- Page 140 and 141:
6.4.2 Household ReportingIn the Hou
- Page 142 and 143:
The unexpectedly low crude death ra
- Page 144 and 145:
Figure 6.8.2 Estimates of Female Ad
- Page 146 and 147:
The third panel estimates life expe
- Page 148 and 149:
Maternal mortality in Afghanistan i
- Page 150 and 151:
other words, about two in five deat
- Page 152 and 153:
It is useful to compare the seven-y
- Page 154 and 155:
50PercentFigure 7.1Timing of Pregna
- Page 156 and 157:
ased on the sibling history (270).
- Page 158 and 159:
The VA interview started by checkin
- Page 160 and 161:
Figure 8.1 Causes of Female and Mal
- Page 162 and 163:
Table 8.4 Causes of deaths among ch
- Page 164 and 165:
Global Agricultural Information Net
- Page 166 and 167:
Streatfield, P.K., S.E. Arifeen, A.
- Page 168 and 169:
• The Cluster Level Questionnaire
- Page 170 and 171:
A.3 STRUCTURE OF THE SAMPLE AND THE
- Page 172 and 173:
ased on sampling probabilities sepa
- Page 175 and 176:
ESTIMATES OF SAMPLING ERRORSAppendi
- Page 177 and 178:
For the total sample, the value of
- Page 179 and 180:
Table B.3 Sampling errors for Urban
- Page 181 and 182:
Table B.5 Sampling errors for North
- Page 183 and 184:
Table B.7 Sampling errors for South
- Page 185 and 186:
Table B.9 Sampling errors for North
- Page 187 and 188:
Table B.11 Sampling errors for Cent
- Page 189 and 190:
Table B.13 Sampling errors for East
- Page 191:
Table B.15 Sampling errors for Sout
- Page 194 and 195:
Table C.2 Myers’ Blended IndexPre
- Page 196 and 197:
Table C.5 Births by calendar years
- Page 198 and 199:
Table C.6 Reporting of age at death
- Page 200 and 201:
Table C.9 Sex ratio of live birthsS
- Page 202 and 203:
mother and the household. The morta
- Page 204 and 205:
The estimated infant mortality rate
- Page 206 and 207:
D.3.1 Evidence of Underreporting of
- Page 208 and 209:
Given the apparent omission of livi
- Page 210 and 211:
totally consistent with the estimat
- Page 212 and 213:
Perhaps a more sensitive indicator
- Page 214 and 215:
Figure D.6 Neonatal and Postneonata
- Page 217 and 218:
PERSONS INVOLVED IN AMS 2010Appendi
- Page 219 and 220:
Office EditorsMaleMohammad NaseemFe
- Page 221 and 222:
AshiqullahAssadullah JavedAtiqullah
- Page 223:
QUESTIONNAIRESAppendix FAppendix F
- Page 226 and 227:
Introduction and ConsentHello. My n
- Page 228 and 229:
SECTION 2. MIGRATION FROM HOUSEHOLD
- Page 230 and 231:
SECTION 4. INPATIENT HEALTH EXPENDI
- Page 232 and 233:
SECTION 5. OUTPATIENT HEALTH EXPEND
- Page 234 and 235:
SECTION 6. HOUSEHOLD CHARACTERISTIC
- Page 236 and 237:
NO. QUESTIONS AND FILTERS CODING CA
- Page 238 and 239:
Introduction and ConsentHello. My n
- Page 240 and 241:
SECTION 2. MARITAL STATUSNO.201QUES
- Page 242 and 243:
Now I would like to record the name
- Page 244 and 245:
SECTION 4. ANTENATAL, DELIVERY AND
- Page 246 and 247:
NO. QUESTIONS AND FILTERS CODING CA
- Page 248 and 249:
NO. QUESTIONS AND FILTERS CODING CA
- Page 250 and 251:
NO. QUESTIONS AND FILTERS CODING CA
- Page 252 and 253:
SECTION 6. MATERNAL MORTALITYNO. QU
- Page 254 and 255:
COMMENTS ABOUT RESPONDENT:INTERVIEW
- Page 256 and 257:
Introduction and ConsentHello. My n
- Page 258 and 259:
DEATH OF A CHILD AGED 0-28 DAYSSECT
- Page 260 and 261:
SECTION 6. DELIVERY HISTORYNO. QUES
- Page 262 and 263:
NO. QUESTIONS AND FILTERS CODING CA
- Page 264 and 265:
NO. QUESTIONS AND FILTERS CODING CA
- Page 266 and 267:
DEATH OF A CHILD AGED 0-28 DAYSSECT
- Page 268 and 269:
DEATH OF A CHILD AGED 0-28 DAYSSECT
- Page 271 and 272:
AFGHANISTAN MORTALITY SURVEYVERBAL
- Page 273 and 274:
DEATH OF A CHILD AGED 29 DAYS TO 11
- Page 275 and 276:
DEATH OF A CHILD AGED 29 DAYS TO 11
- Page 277 and 278:
DEATH OF A CHILD AGED 29 DAYS TO 11
- Page 279 and 280:
DEATH OF A CHILD AGED 29 DAYS TO 11
- Page 281 and 282:
DEATH OF A CHILD AGED 29 DAYS TO 11
- Page 283 and 284:
DEATH OF A CHILD AGED 29 DAYS TO 11
- Page 285:
DEATH OF A CHILD AGED 29 DAYS TO 14
- Page 288 and 289:
Introduction and ConsentHello. My n
- Page 290 and 291:
401 Could you tell me about the ill
- Page 292 and 293:
DEATH OF A PERSON AGED 12 YEARS AND
- Page 294 and 295:
DEATH OF A PERSON AGED 12 YEARS AND
- Page 296 and 297:
DEATH OF A PERSON AGED 12 YEARS AND
- Page 298 and 299:
DEATH OF A PERSON AGED 12 YEARS AND
- Page 300 and 301:
DEATH OF A PERSON AGED 12 YEARS AND
- Page 302 and 303:
NO. QUESTIONS AND FILTERS CODING CA
- Page 304 and 305:
DEATH OF A PERSON AGED 12 YEARS AND
- Page 306 and 307:
DEATH OF A PERSON AGED 12 YEARS AND


![Obtaining Informed Consent for HIV Testing [QRS4] - Measure DHS](https://img.yumpu.com/49850117/1/190x245/obtaining-informed-consent-for-hiv-testing-qrs4-measure-dhs.jpg?quality=85)


