- Page 1:
AfghanistanMortality Survey 2010
- Page 5 and 6: CONTENTSTABLES AND FIGURES ........
- Page 7 and 8: 4.3 Postnatal Care.................
- Page 9 and 10: TABLES AND FIGURESCHAPTER 1INTRODUC
- Page 11 and 12: Table 5.2 Early childhood mortality
- Page 13: APPENDIX CDATA QUALITY TABLESTable
- Page 17: AMS 2010 TECHNICAL ADVISORY GROUP M
- Page 21 and 22: AMS 2010 CONTRIBUTORS TO THE REPORT
- Page 23 and 24: INTRODUCTION 11.1 GEOGRAPHY, HISTOR
- Page 25 and 26: After the fall of the communist reg
- Page 27 and 28: Afghanistan, in cooperation with th
- Page 29 and 30: workload of the BHC, up to two addi
- Page 31 and 32: complete list of names of persons i
- Page 33 and 34: 1.7 QUESTIONNAIRESFour questionnair
- Page 35 and 36: survey, a detailed review of the qu
- Page 37 and 38: 1.10 RESPONSE RATESTable 1.2 shows
- Page 39: 72 percent of the rural population
- Page 42 and 43: Figure 2.1 Population Pyramid80 +75
- Page 44 and 45: Table 2.3 Children’s orphanhood s
- Page 46 and 47: Table 2.5 presents information on h
- Page 48 and 49: Table 2.7 Household possessionsPerc
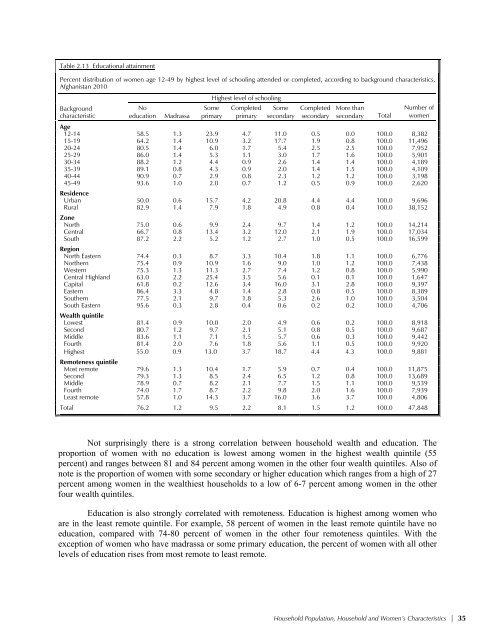
- Page 50 and 51: emoteness, and the scores were summ
- Page 52 and 53: The analysis also suggests that amo
- Page 54 and 55: Central zone (56 percent) has the h
- Page 58 and 59: 2.10 CONCLUSIONThe AMS 2010 enumera
- Page 60 and 61: 3.1.2 Data Quality AssessmentThe pr
- Page 62 and 63: more problematic for the estimates
- Page 64 and 65: Table 3.2 Fertility by background c
- Page 66 and 67: Another frequently used approach to
- Page 68 and 69: 3.2.6 Birth IntervalsA birth interv
- Page 70 and 71: 3.2.7 Age at First BirthThe onset o
- Page 72 and 73: Table 3.9 Teenage pregnancy and mot
- Page 74 and 75: Table 3.11 Age at first marriagePer
- Page 76 and 77: the community level by utilizing al
- Page 78 and 79: difference may be due to difference
- Page 80 and 81: There are substantial differences i
- Page 82 and 83: Table 3.17 Total fertility rate and
- Page 85 and 86: MATERNAL HEALTH 4Afghanistan is com
- Page 87 and 88: Table 4.1 Antenatal carePercent dis
- Page 89 and 90: Figure 4.2 Trends in Antenatal Care
- Page 91 and 92: 4.1.3 Problems with Pregnancy at Fi
- Page 93 and 94: 4.1.4 Number and Timing of Antenata
- Page 95 and 96: About one-third (32 percent) of mot
- Page 97 and 98: As with other maternal health indic
- Page 99 and 100: Table 4.8 Reasons for not deliverin
- Page 101 and 102: Table 4.9 Assistance during deliver
- Page 103 and 104: 4.2.4 Procedures Performed at Deliv
- Page 105 and 106: Figure 4.6 Reasons for Not Seeking
- Page 107 and 108:
Table 4.12 presents information on
- Page 109 and 110:
Table 4.13 Problems in accessing he
- Page 111 and 112:
INFANT AND CHILD MORTALITY 5Early c
- Page 113 and 114:
first seven days of life, to estima
- Page 115 and 116:
In considering the mortality trends
- Page 117 and 118:
data was found in Afghanistan exclu
- Page 119 and 120:
Central zone and 32 percent in the
- Page 121 and 122:
Table 5.4 Early childhood mortality
- Page 123 and 124:
The patterns of perinatal mortality
- Page 125:
problem for areas outside the South
- Page 128 and 129:
information was usually reported by
- Page 130 and 131:
fallen from 118 deaths to 71 deaths
- Page 132 and 133:
Table 6.4 shows adult mortality rat
- Page 134 and 135:
mortality levels. The procedures us
- Page 136 and 137:
Table 6.6 Female and male life tabl
- Page 138 and 139:
Table 6.7 Mean sibship size and sex
- Page 140 and 141:
6.4.2 Household ReportingIn the Hou
- Page 142 and 143:
The unexpectedly low crude death ra
- Page 144 and 145:
Figure 6.8.2 Estimates of Female Ad
- Page 146 and 147:
The third panel estimates life expe
- Page 148 and 149:
Maternal mortality in Afghanistan i
- Page 150 and 151:
other words, about two in five deat
- Page 152 and 153:
It is useful to compare the seven-y
- Page 154 and 155:
50PercentFigure 7.1Timing of Pregna
- Page 156 and 157:
ased on the sibling history (270).
- Page 158 and 159:
The VA interview started by checkin
- Page 160 and 161:
Figure 8.1 Causes of Female and Mal
- Page 162 and 163:
Table 8.4 Causes of deaths among ch
- Page 164 and 165:
Global Agricultural Information Net
- Page 166 and 167:
Streatfield, P.K., S.E. Arifeen, A.
- Page 168 and 169:
• The Cluster Level Questionnaire
- Page 170 and 171:
A.3 STRUCTURE OF THE SAMPLE AND THE
- Page 172 and 173:
ased on sampling probabilities sepa
- Page 175 and 176:
ESTIMATES OF SAMPLING ERRORSAppendi
- Page 177 and 178:
For the total sample, the value of
- Page 179 and 180:
Table B.3 Sampling errors for Urban
- Page 181 and 182:
Table B.5 Sampling errors for North
- Page 183 and 184:
Table B.7 Sampling errors for South
- Page 185 and 186:
Table B.9 Sampling errors for North
- Page 187 and 188:
Table B.11 Sampling errors for Cent
- Page 189 and 190:
Table B.13 Sampling errors for East
- Page 191:
Table B.15 Sampling errors for Sout
- Page 194 and 195:
Table C.2 Myers’ Blended IndexPre
- Page 196 and 197:
Table C.5 Births by calendar years
- Page 198 and 199:
Table C.6 Reporting of age at death
- Page 200 and 201:
Table C.9 Sex ratio of live birthsS
- Page 202 and 203:
mother and the household. The morta
- Page 204 and 205:
The estimated infant mortality rate
- Page 206 and 207:
D.3.1 Evidence of Underreporting of
- Page 208 and 209:
Given the apparent omission of livi
- Page 210 and 211:
totally consistent with the estimat
- Page 212 and 213:
Perhaps a more sensitive indicator
- Page 214 and 215:
Figure D.6 Neonatal and Postneonata
- Page 217 and 218:
PERSONS INVOLVED IN AMS 2010Appendi
- Page 219 and 220:
Office EditorsMaleMohammad NaseemFe
- Page 221 and 222:
AshiqullahAssadullah JavedAtiqullah
- Page 223:
QUESTIONNAIRESAppendix FAppendix F
- Page 226 and 227:
Introduction and ConsentHello. My n
- Page 228 and 229:
SECTION 2. MIGRATION FROM HOUSEHOLD
- Page 230 and 231:
SECTION 4. INPATIENT HEALTH EXPENDI
- Page 232 and 233:
SECTION 5. OUTPATIENT HEALTH EXPEND
- Page 234 and 235:
SECTION 6. HOUSEHOLD CHARACTERISTIC
- Page 236 and 237:
NO. QUESTIONS AND FILTERS CODING CA
- Page 238 and 239:
Introduction and ConsentHello. My n
- Page 240 and 241:
SECTION 2. MARITAL STATUSNO.201QUES
- Page 242 and 243:
Now I would like to record the name
- Page 244 and 245:
SECTION 4. ANTENATAL, DELIVERY AND
- Page 246 and 247:
NO. QUESTIONS AND FILTERS CODING CA
- Page 248 and 249:
NO. QUESTIONS AND FILTERS CODING CA
- Page 250 and 251:
NO. QUESTIONS AND FILTERS CODING CA
- Page 252 and 253:
SECTION 6. MATERNAL MORTALITYNO. QU
- Page 254 and 255:
COMMENTS ABOUT RESPONDENT:INTERVIEW
- Page 256 and 257:
Introduction and ConsentHello. My n
- Page 258 and 259:
DEATH OF A CHILD AGED 0-28 DAYSSECT
- Page 260 and 261:
SECTION 6. DELIVERY HISTORYNO. QUES
- Page 262 and 263:
NO. QUESTIONS AND FILTERS CODING CA
- Page 264 and 265:
NO. QUESTIONS AND FILTERS CODING CA
- Page 266 and 267:
DEATH OF A CHILD AGED 0-28 DAYSSECT
- Page 268 and 269:
DEATH OF A CHILD AGED 0-28 DAYSSECT
- Page 271 and 272:
AFGHANISTAN MORTALITY SURVEYVERBAL
- Page 273 and 274:
DEATH OF A CHILD AGED 29 DAYS TO 11
- Page 275 and 276:
DEATH OF A CHILD AGED 29 DAYS TO 11
- Page 277 and 278:
DEATH OF A CHILD AGED 29 DAYS TO 11
- Page 279 and 280:
DEATH OF A CHILD AGED 29 DAYS TO 11
- Page 281 and 282:
DEATH OF A CHILD AGED 29 DAYS TO 11
- Page 283 and 284:
DEATH OF A CHILD AGED 29 DAYS TO 11
- Page 285:
DEATH OF A CHILD AGED 29 DAYS TO 14
- Page 288 and 289:
Introduction and ConsentHello. My n
- Page 290 and 291:
401 Could you tell me about the ill
- Page 292 and 293:
DEATH OF A PERSON AGED 12 YEARS AND
- Page 294 and 295:
DEATH OF A PERSON AGED 12 YEARS AND
- Page 296 and 297:
DEATH OF A PERSON AGED 12 YEARS AND
- Page 298 and 299:
DEATH OF A PERSON AGED 12 YEARS AND
- Page 300 and 301:
DEATH OF A PERSON AGED 12 YEARS AND
- Page 302 and 303:
NO. QUESTIONS AND FILTERS CODING CA
- Page 304 and 305:
DEATH OF A PERSON AGED 12 YEARS AND
- Page 306 and 307:
DEATH OF A PERSON AGED 12 YEARS AND


![Obtaining Informed Consent for HIV Testing [QRS4] - Measure DHS](https://img.yumpu.com/49850117/1/190x245/obtaining-informed-consent-for-hiv-testing-qrs4-measure-dhs.jpg?quality=85)


