PIK Biennial Report 2000-2001 - Potsdam Institute for Climate ...
PIK Biennial Report 2000-2001 - Potsdam Institute for Climate ...
PIK Biennial Report 2000-2001 - Potsdam Institute for Climate ...

Create successful ePaper yourself
Turn your PDF publications into a flip-book with our unique Google optimized e-Paper software.
Completed Projects<br />
QUESTIONS<br />
Qualitative Dynamics of Syndromes and Transition to Sustainability<br />
Project leader: Gerhard Petschel-Held<br />
<strong>PIK</strong> project members: Martin Cassel-Gintz, Matthias<br />
Lüdeke, Fritz Reusswig, Hans Joachim Schellnhuber.<br />
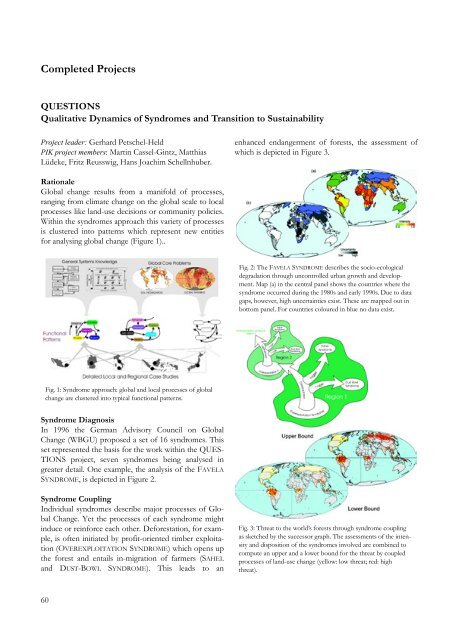
Rationale<br />
Global change results from a manifold of processes,<br />
ranging from climate change on the global scale to local<br />
processes like land-use decisions or community policies.<br />
Within the syndromes approach this variety of processes<br />
is clustered into patterns which represent new entities<br />
<strong>for</strong> analysing global change (Figure 1)..<br />
Fig. 1: Syndrome approach: global and local processes of global<br />
change are clustered into typical functional patterns.<br />
Syndrome Diagnosis<br />
In 1996 the German Advisory Council on Global<br />
Change (WBGU) proposed a set of 16 syndromes. This<br />
set represented the basis <strong>for</strong> the work within the QUES-<br />
TIONS project, seven syndromes being analysed in<br />
greater detail. One example, the analysis of the FAVELA<br />
SYNDROME, is depicted in Figure 2.<br />
Syndrome Coupling<br />
Individual syndromes describe major processes of Global<br />
Change. Yet the processes of each syndrome might<br />
induce or rein<strong>for</strong>ce each other. De<strong>for</strong>estation, <strong>for</strong> example,<br />
is often initiated by profit-oriented timber exploitation<br />
(OVEREXPLOITATION SYNDROME) which opens up<br />
the <strong>for</strong>est and entails in-migration of farmers (SAHEL<br />
and DUST-BOWL SYNDROME). This leads to an<br />
60<br />
enhanced endangerment of <strong>for</strong>ests, the assessment of<br />
which is depicted in Figure 3.<br />
Fig. 2: The FAVELA SYNDROME describes the socio-ecological<br />
degradation through uncontrolled urban growth and development.<br />
Map (a) in the central panel shows the countries where the<br />
syndrome occurred during the 1980s and early 1990s. Due to data<br />
gaps, however, high uncertainties exist. These are mapped out in<br />
bottom panel. For countries coloured in blue no data exist.<br />
Fig. 3: Threat to the world’s <strong>for</strong>ests through syndrome coupling<br />
as sketched by the successor graph. The assessments of the intensity<br />
and disposition of the syndromes involved are combined to<br />
compute an upper and a lower bound <strong>for</strong> the threat by coupled<br />
processes of land-use change (yellow: low threat; red: high<br />
threat).