2003 - 04 Annual Report - Sbs
2003 - 04 Annual Report - Sbs
2003 - 04 Annual Report - Sbs
- No tags were found...

You also want an ePaper? Increase the reach of your titles
YUMPU automatically turns print PDFs into web optimized ePapers that Google loves.
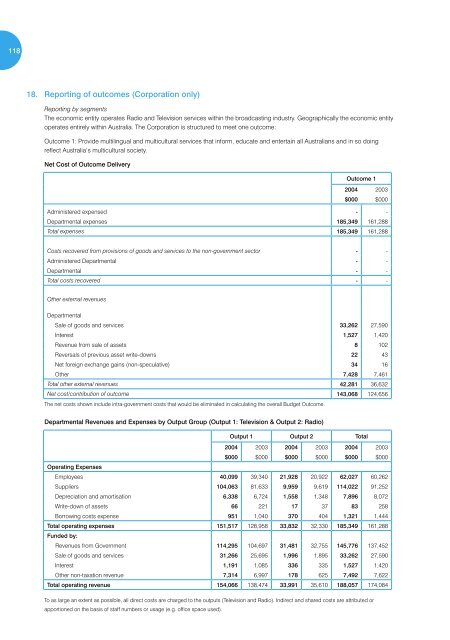
11818. <strong>Report</strong>ing of outcomes (Corporation only)<strong>Report</strong>ing by segmentsThe economic entity operates Radio and Television services within the broadcasting industry. Geographically the economic entityoperates entirely within Australia. The Corporation is structured to meet one outcome:Outcome 1: Provide multilingual and multicultural services that inform, educate and entertain all Australians and in so doingreflect Australia’s multicultural society.Net Cost of Outcome DeliveryOutcome 120<strong>04</strong> <strong>2003</strong>$000 $000Administered expensed - -Departmental expenses 185,349 161,288Total expenses 185,349 161,288Costs recovered from provisions of goods and services to the non-government sector - -Administered Departmental - -Departmental - -Total costs recovered - -Other external revenuesDepartmentalSale of goods and services 33,262 27,590Interest 1,527 1,420Revenue from sale of assets 8 102Reversals of previous asset write-downs 22 43Net foreign exchange gains (non-speculative) 34 16Other 7,428 7,461Total other external revenues 42,281 36,632Net cost/contribution of outcome 143,068 124,656The net costs shown include intra-government costs that would be eliminated in calculating the overall Budget Outcome.Departmental Revenues and Expenses by Output Group (Output 1: Television & Output 2: Radio)Output 1 Output 2 Total20<strong>04</strong> <strong>2003</strong> 20<strong>04</strong> <strong>2003</strong> 20<strong>04</strong> <strong>2003</strong>$000 $000 $000 $000 $000 $000Operating ExpensesEmployees 40,099 39,340 21,928 20,922 62,027 60,262Suppliers 1<strong>04</strong>,063 81,633 9,959 9,619 114,022 91,252Depreciation and amortisation 6,338 6,724 1,558 1,348 7,896 8,072Write-down of assets 66 221 17 37 83 258Borrowing costs expense 951 1,<strong>04</strong>0 370 4<strong>04</strong> 1,321 1,444Total operating expenses 151,517 128,958 33,832 32,330 185,349 161,288Funded by:Revenues from Government 114,295 1<strong>04</strong>,697 31,481 32,755 145,776 137,452Sale of goods and services 31,266 25,695 1,996 1,895 33,262 27,590Interest 1,191 1,085 336 335 1,527 1,420Other non-taxation revenue 7,314 6,997 178 625 7,492 7,622Total operating revenue 154,066 138,474 33,991 35,610 188,057 174,084To as large an extent as possible, all direct costs are charged to the outputs (Television and Radio). Indirect and shared costs are attributed orapportioned on the basis of staff numbers or usage (e.g. office space used).