Deliverable D 1.3 RESULTS OF META-ANALYSIS ... - cast-eu.org
Deliverable D 1.3 RESULTS OF META-ANALYSIS ... - cast-eu.org
Deliverable D 1.3 RESULTS OF META-ANALYSIS ... - cast-eu.org

Create successful ePaper yourself
Turn your PDF publications into a flip-book with our unique Google optimized e-Paper software.
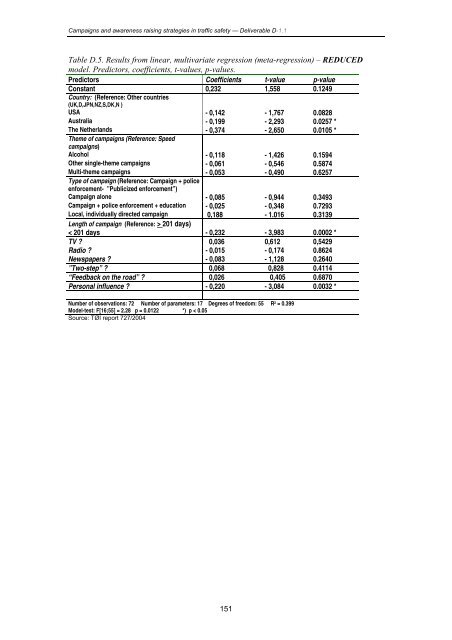
Campaigns and awareness raising strategies in traffic safety — <strong>Deliverable</strong> D-1.1Table D.5. Results from linear, multivariate regression (meta-regression) – REDUCEDmodel. Predictors, coefficients, t-values, p-values.Predictors Coefficients t-value p-valueConstant 0,232 1,558 0.1249Country: (Reference: Other countries(UK,D,JPN,NZ,S,DK,N )USA - 0,142 - 1,767 0.0828Australia - 0,199 - 2,293 0.0257 *The Netherlands - 0,374 - 2,650 0.0105 *Theme of campaigns (Reference: Speedcampaigns)Alcohol - 0,118 - 1,426 0.1594Other single-theme campaigns - 0,061 - 0,546 0.5874Multi-theme campaigns - 0,053 - 0,490 0.6257Type of campaign (Reference: Campaign + policeenforcement- ”Publicized enforcement”)Campaign alone - 0,085 - 0,944 0.3493Campaign + police enforcement + education - 0,025 - 0,348 0.7293Local, individually directed campaign 0,188 - 1.016 0.3139Length of campaign (Reference: > 201 days)< 201 days - 0,232 - 3,983 0.0002 *TV ? 0,036 0,612 0,5429Radio ? - 0,015 - 0,174 0.8624Newspapers ? - 0,083 - 1,128 0.2640”Two-step” ? 0,068 0,828 0.4114“Feedback on the road” ? 0,026 0,405 0.6870Personal influence ? - 0,220 - 3,084 0.0032 *Number of observations: 72 Number of parameters: 17 Degrees of freedom: 55 R 2 = 0.399Model-test: F[16;55] = 2.28 p = 0.0122 *) p < 0.05Source: TØI report 727/2004151