The U.S. <strong>Climate</strong> <strong>Change</strong> <strong>Science</strong> <strong>Program</strong>Chapter 3In climate modelprojections of thecurrent century,many already wetareas of the planetget wetter andalready dry areasget drier.trends related to the Holocene history of theglobal monsoon described above (e.g., Wanget al., 2005).The ultimate controls of these variationsinclude (1) the continued influence of thelong-term changes in insolation that appear tobe ultimately responsible for the mid-Holoceneclimate anomalies discussed above, (2) theintegration of interannual variations in climatethat arise from ocean-atmosphere coupling, and(3) the impact of the variations in volcanism,solar irradiance, long-lived greenhouse gasesand aerosols, and land-cover responsible forclimatic variations over the past two millennia(Jansen et al., 2007, IPCC AR4 WG1, Sec. 6.6)or some combination of these three controls.(See also <strong>Climate</strong> Research Committee, NationalResearch Council, 1995.)No one of these potential controls can accountfor all of the variations observed in hydrologicalindicators over the past two millennia. By thelate Holocene, the amplitude of the insolationanomalies is quite small (Fig. 3.13A–B), and theimpact of deglaciation is no longer significant(Fig. 3.13C–D). Variations in indices thatdescribe decadal-time-scale ocean-atmosphereinteractions, often known as “teleconnection”or “climate-mode” indices (e.g., the PDO or“Pacific Decadal Oscillation” or the NAM or“Northern Annular Mode”; see Trenberth etal., 2007, IPCC AR4 WG1 Sec. 3.6 for review),are sometimes invoked to explain apparent periodicityor “regime changes” in proxy records(e.g., Stone and Fritz, 2006; Rasmussen et al.,2006). However, the observational records thatare used to define those indices are not longenough to discriminate among true cyclical oroscillatory behavior, recurrent changes in levels(or regime shifts), and simple red-noise or autocorrelatedvariations in time series (Rudnickand Davis, 2003; Overland et al., 2006), soperceived periodicities in paleoenvironmentalrecords could arise from sources other than, forexample, solar irradiance cycles inferred from14C-production records. Moreover, there are nophysical mechanisms that might account fordecadal-scale variations over long time spansin, for example, the PDO, apart from thosethat involve the integration of the shorter timescalevariations (i.e., ENSO; Newman et al.,2003; Schneider and Cornuelle, 2005). Finally,although the broad trend global or hemisphericaveragetemperatures over the past millenniumseem reasonably well accounted for by the combinationsof factors described in (3) above, thereis little short-term agreement among differentsimulations. Consequently, despite their societalimportance (e.g., <strong>Climate</strong> Research Committee,1995), the genesis of centennial-scale climaticand hydrologic variations remains essentiallyunexplained.5. Future SubtropicalDrying: Dynamics,Paleocontext, andImplicationsIt is a robust result in climate model projectionsof the climate of the current century that manyalready wet areas of the planet get wetter—suchas in the oceanic Intertropical ConvergenceZone (ITCZ), the Asian monsoonal region,and equatorial Africa—and already dry areasget drier—such as the oceanic subtropical highpressure zones, southwestern North America,the Intra-America Seas, the Mediterraneanregion, and southern Africa (Held and Soden,2006); see also Hoerling et al. (2006). Dryingand wetting as used here refer to the precipitationminus the surface evaporation, or P–E. P–Eis the quantity that, in the long-term mean overland, balances surface and subsurface runoffand, in the atmosphere, balances the verticallyintegrated moisture convergence or divergence.The latter contains components due to theconvergence or divergence of water vapor bythe mean flow convergence or divergence, theadvection of humidity by the mean flow, andthe convergence or divergence of humidity bythe transient flow. A warmer atmosphere canhold more moisture, so the pattern of moistureconvergence or divergence by the mean flowconvergence or divergence intensifies. Thismakes the deep tropical regions of the ITCZwetter and the dry regions of the subtropics,where there is descending air and mean flowdivergence, drier (Held and Soden, 2006).While a warming-induced intensification ofhydrological gradients is a good first start fordescribing hydrological change, there are manyexceptions to this simple picture. For example,the Amazon is a wet region where models donot robustly predict either a drying or a wetting.106
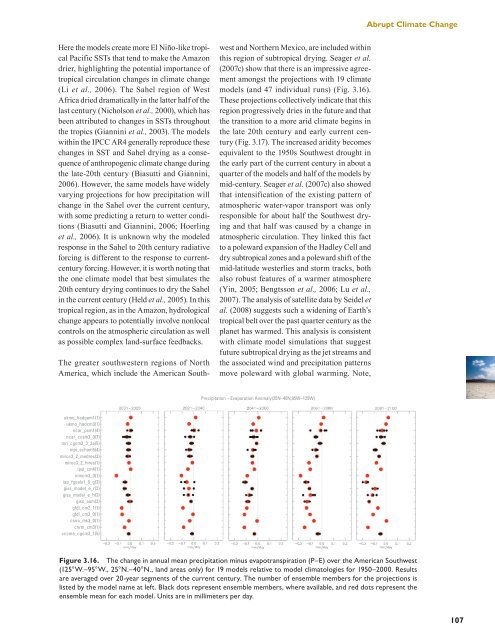
Abrupt <strong>Climate</strong> <strong>Change</strong>Here the models create more El Niño-like tropicalPacific SSTs that tend to make the Amazondrier, highlighting the potential importance oftropical circulation changes in climate change(Li et al., 2006). The Sahel region of WestAfrica dried dramatically in the latter half of thelast century (Nicholson et al., 2000), which hasbeen attributed to changes in SSTs throughoutthe tropics (Giannini et al., 2003). The modelswithin the IPCC AR4 generally reproduce thesechanges in SST and Sahel drying as a consequenceof anthropogenic climate change duringthe late-20th century (Biasutti and Giannini,2006). However, the same models have widelyvarying projections for how precipitation willchange in the Sahel over the current century,with some predicting a return to wetter conditions(Biasutti and Giannini, 2006; Hoerlinget al., 2006). It is unknown why the modeledresponse in the Sahel to 20th century radiativeforcing is different to the response to currentcenturyforcing. However, it is worth noting thatthe one climate model that best simulates the20th century drying continues to dry the Sahelin the current century (Held et al., 2005). In thistropical region, as in the Amazon, hydrologicalchange appears to potentially involve nonlocalcontrols on the atmospheric circulation as wellas possible complex land-surface feedbacks.The greater southwestern regions of NorthAmerica, which include the American Southwestand Northern Mexico, are included withinthis region of subtropical drying. Seager et al.(2007c) show that there is an impressive agreementamongst the projections with 19 climatemodels (and 47 individual runs) (Fig. 3.16).These projections collectively indicate that thisregion progressively dries in the future and thatthe transition to a more arid climate begins inthe late 20th century and early current century(Fig. 3.17). The increased aridity becomesequivalent to the 1950s Southwest drought inthe early part of the current century in about aquarter of the models and half of the models bymid-century. Seager et al. (2007c) also showedthat intensification of the existing pattern ofatmospheric water-vapor transport was onlyresponsible for about half the Southwest dryingand that half was caused by a change inatmospheric circulation. They linked this factto a poleward expansion of the Hadley Cell anddry subtropical zones and a poleward shift of themid-latitude westerlies and storm tracks, bothalso robust features of a warmer atmosphere(Yin, 2005; Bengtsson et al., 2006; Lu et al.,2007). The analysis of satellite data by Seidel etal. (2008) suggests such a widening of Earth’stropical belt over the past quarter century as theplanet has warmed. This analysis is consistentwith climate model simulations that suggestfuture subtropical drying as the jet streams andthe associated wind and precipitation patternsmove poleward with global warming. Note,Precipitation – Evaporation Anomaly(25N–40N,95W–125W)ukmo_hadgem1(1)ukmo_hadcm3(1)ncar_pcm1(4)ncar_ccsm3_0(7)mri_cgcm2_3_2a(5)mpi_echam5(4)miroc3_2_medres(3)miroc3_2_hires(1)ipsl_cm4(1)inmcm3_0(1)iap_fgoals1_0_g(3)giss_model_e_r(2)giss_model_e_h(3)giss_aom(2)gfdl_cm2_1(1)gfdl_cm2_0(1)csiro_mk3_0(1)cnrm_cm3(1)cccma_cgcm3_1(5)Figure 3.16. The change in annual mean precipitation minus evapotranspiration (P–E) over the American Southwest(125°W.–95°W., 25°N.–40°N., land areas only) for 19 models relative to model climatologies for 1950–2000. Resultsare averaged over 20-year segments of the current century. The number of ensemble members for the projections islisted by the model name at left. Black dots represent ensemble members, where available, and red dots represent theensemble mean for each model. Units are in millimeters per day.107