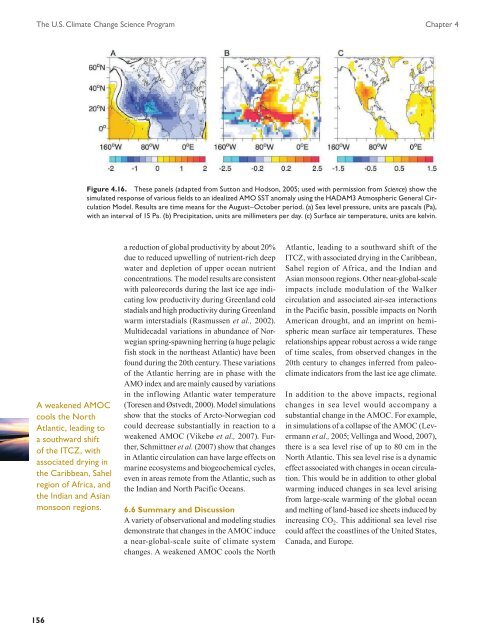
The U.S. <strong>Climate</strong> <strong>Change</strong> <strong>Science</strong> <strong>Program</strong> Chapter 4Figure 4.16. These panels (adapted from Sutton and Hodson, 2005; used with permission from <strong>Science</strong>) show thesimulated response of various fields to an idealized AMO SST anomaly using the HADAM3 Atmospheric General CirculationModel. Results are time means for the August–October period. (a) Sea level pressure, units are pascals (Pa),with an interval of 15 Pa. (b) Precipitation, units are millimeters per day. (c) Surface air temperature, units are kelvin.A weakened AMOCcools the NorthAtlantic, leading toa southward shiftof the ITCZ, withassociated drying inthe Caribbean, Sahelregion of Africa, andthe Indian and Asianmonsoon regions.a reduction of global productivity by about 20%due to reduced upwelling of nutrient-rich deepwater and depletion of upper ocean nutrientconcentrations. The model results are consistentwith paleorecords during the last ice age indicatinglow productivity during Greenland coldstadials and high productivity during Greenlandwarm interstadials (Rasmussen et al., 2002).Multidecadal variations in abundance of Norwegianspring-spawning herring (a huge pelagicfish stock in the northeast Atlantic) have beenfound during the 20th century. These variationsof the Atlantic herring are in phase with theAMO index and are mainly caused by variationsin the inflowing Atlantic water temperature(Toresen and Østvedt, 2000). Model simulationsshow that the stocks of Arcto-Norwegian codcould decrease substantially in reaction to aweakened AMOC (Vikebø et al., 2007). Further,Schmittner et al. (2007) show that changesin Atlantic circulation can have large effects onmarine ecosystems and biogeochemical cycles,even in areas remote from the Atlantic, such asthe Indian and North Pacific Oceans.6.6 Summary and DiscussionA variety of observational and modeling studiesdemonstrate that changes in the AMOC inducea near-global-scale suite of climate systemchanges. A weakened AMOC cools the NorthAtlantic, leading to a southward shift of theITCZ, with associated drying in the Caribbean,Sahel region of Africa, and the Indian andAsian monsoon regions. Other near-global-scaleimpacts include modulation of the Walkercirculation and associated air-sea interactionsin the Pacific basin, possible impacts on NorthAmerican drought, and an imprint on hemisphericmean surface air temperatures. Theserelationships appear robust across a wide rangeof time scales, from observed changes in the20th century to changes inferred from paleoclimateindicators from the last ice age climate.In addition to the above impacts, regionalchanges in sea level would accompany asubstantial change in the AMOC. For example,in simulations of a collapse of the AMOC (Levermannet al., 2005; Vellinga and Wood, 2007),there is a sea level rise of up to 80 cm in theNorth Atlantic. This sea level rise is a dynamiceffect associated with changes in ocean circulation.This would be in addition to other globalwarming induced changes in sea level arisingfrom large-scale warming of the global oceanand melting of land-based ice sheets induced byincreasing CO 2 . This additional sea level risecould affect the coastlines of the United States,Canada, and Europe.156
Abrupt <strong>Climate</strong> <strong>Change</strong>7. What Factors ThatInfluence the OverturningCirculation Are Likely To<strong>Change</strong> in the Future, andWhat is the ProbabilityThat the OverturningCirculation Will <strong>Change</strong>?As noted in the Intergovernmental Panel for<strong>Climate</strong> <strong>Change</strong> (IPCC) Fourth AssessmentReport (AR4), all climate model projectionsunder increasing greenhouse gases lead toan increase in high-latitude temperature aswell as an increase in high-latitude precipitation(Meehl et al., 2007). Both warming andfreshening tend to make the high-latitudesurface waters less dense, thereby increasingtheir stability and inhibiting convection.In the IPCC AR4, 19 coupled atmosphere-oceanmodels contributed projections of future climatechange under the SRES A1B scenario (Meehlet al., 2007). Of these, 16 models did not useflux adjustments (all except CGCM3.1, INM-CM3.0, and MRI-CGCM2.3.2). In makingtheir assessment, Meehl et al. (2007) notedthat several of the models simulated a late 20thcentury AMOC strength that was inconsistentwith present-day estimates: 14–18 Sv at 24°N.(Ganachaud and Wunsch, 2000; Lumpkin andSpeer, 2003); 13–19 Sv at 48°N. (Ganachaud,2003a); maximum values of 17.2 Sv (Smethieand Fine, 2001) and 18 Sv (Talley et al., 2003)with an error of ± 3–5 Sv. As a consequenceof their poor 20th century simulations, thesemodels were not used in their assessment.The full range of late 20th century estimatesof the Atlantic MOC strength (12–23 Sv) isspanned by the model simulations (Fig. 4.17;Schmittner et al., 2005; Meehl et al., 2007).The models further project a decrease in theAMOC strength of between 0% and 50%,with a multimodel average of 25%, over thecourse of the 21st century. None of the modelssimulated an abrupt shutdown of the AMOCduring the 21st century.Schneider et al. (2007) extended the analysisof Meehl et al. (2007) by developing a multimodelaverage in which the individual modelsimulations were weighted a number of ways.The various weighting estimates were basedon an individual model’s simulation of thecontemporary ocean climate, and in particularits simulated fields of temperature, salinity,pycnocline depth, as well as its simulated AtlanticMOC strength. Their resulting best estimate21st century AMOC weakening of 25–30% wasinvariant to the weighting scheme used and isconsistent with the simple multimodel mean of25% obtained in the IPCC AR4.In early versions of some coupled atmosphereoceanmodels, (e.g., Dixon et al., 1999), increasedhigh-latitude precipitation dominatedover increased high-latitude warming in causingthe projected weakening of the AMOCunder increasing greenhouse gases, while inothers (e.g., Mikolajewicz and Voss, 2000), theopposite was found. However, Gregory et al.(2005) undertook a recent model intercomparisonproject in which, in all 11 models analyzed,the AMOC reduction was caused more bychanges in surface heat flux than changes insurface freshwater flux. Weaver et al. (2007)extended this analysis by showing that, in onemodel, this conclusion was independent of theinitial mean climate state.A number of stabilization scenarios have beenexamined using both coupled Atmosphere-Ocean General Circulation Models (AOGCMs)(Stouffer and Manabe, 1999; Voss and Mikolajewicz,2001; Stouffer and Manabe, 2003;Wood et al., 2003; Yoshida et al., 2005; Bryanet al., 2006) as well as Earth System Models ofIntermediate Complexity (EMICs) (Meehl etal., 2007). Typically the atmospheric CO 2 concentrationin these models is increased at a rateof 1%/year to either two times or four times thepreindustrial level of atmospheric CO 2 , and heldfixed thereafter. In virtually every simulation,the AMOC reduces but recovers to its initialstrength when the radiative forcing is stabilizedat two times or four times the preindustriallevels of CO 2 . Only one early flux-adjustedmodel simulated a complete shutdown, and eventhis was not permanent (Manabe and Stouffer,1994; Stouffer and Manabe, 2003). The onlymodel to exhibit a permanent cessation of theAMOC in response to increasing greenhousegases was an intermediate complexity modelwhich incorporates a zonally averaged oceancomponent (Meehl et al., 2007).157