Book 2.indb - US Climate Change Science Program
Book 2.indb - US Climate Change Science Program
Book 2.indb - US Climate Change Science Program
- No tags were found...
Create successful ePaper yourself
Turn your PDF publications into a flip-book with our unique Google optimized e-Paper software.
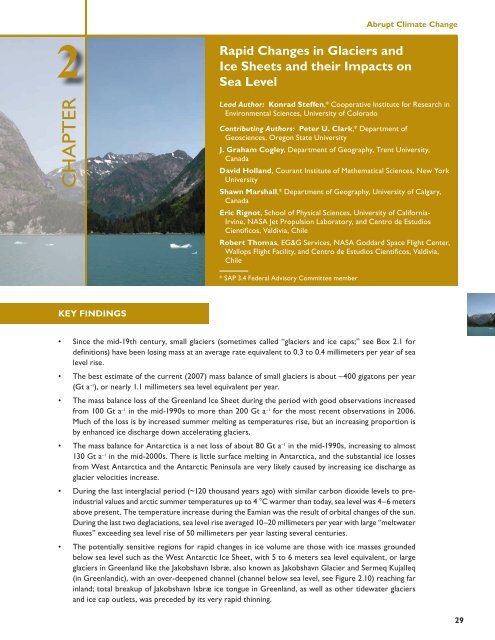
2CHAPTERAbrupt <strong>Climate</strong> <strong>Change</strong>Rapid <strong>Change</strong>s in Glaciers andIce Sheets and their Impacts onSea LevelLead Author: konrad Steffen,* Cooperative Institute for Research inEnvironmental <strong>Science</strong>s, University of ColoradoContributing Authors: Peter U. Clark,* Department ofGeosciences, Oregon State Universityj. Graham Cogley, Department of Geography, Trent University,CanadaDavid Holland, Courant Institute of Mathematical <strong>Science</strong>s, New YorkUniversityShawn Marshall,* Department of Geography, University of Calgary,CanadaEric Rignot, School of Physical <strong>Science</strong>s, University of California-Irvine, NASA Jet Propulsion Laboratory, and Centro de EstudiosCientifi cos, Valdivia, ChileRobert Thomas, EG&G Services, NASA Goddard Space Flight Center,Wallops Flight Facility, and Centro de Estudios Cientifi cos, Valdivia,Chile* SAP 3.4 Federal Advisory Committee memberkEy FINDINGS• Since the mid-19th century, small glaciers (sometimes called “glaciers and ice caps;” see Box 2.1 fordefinitions) have been losing mass at an average rate equivalent to 0.3 to 0.4 millimeters per year of sealevel rise.• The best estimate of the current (2007) mass balance of small glaciers is about –400 gigatons per year(Gt a –1 ), or nearly 1.1 millimeters sea level equivalent per year.• The mass balance loss of the Greenland Ice Sheet during the period with good observations increasedfrom 100 Gt a –1 in the mid-1990s to more than 200 Gt a –1 for the most recent observations in 2006.Much of the loss is by increased summer melting as temperatures rise, but an increasing proportion isby enhanced ice discharge down accelerating glaciers.• The mass balance for Antarctica is a net loss of about 80 Gt a –1 in the mid-1990s, increasing to almost130 Gt a –1 in the mid-2000s. There is little surface melting in Antarctica, and the substantial ice lossesfrom West Antarctica and the Antarctic Peninsula are very likely caused by increasing ice discharge asglacier velocities increase.• During the last interglacial period (~120 thousand years ago) with similar carbon dioxide levels to preindustrialvalues and arctic summer temperatures up to 4 °C warmer than today, sea level was 4–6 metersabove present. The temperature increase during the Eamian was the result of orbital changes of the sun.During the last two deglaciations, sea level rise averaged 10–20 millimeters per year with large “meltwaterfluxes” exceeding sea level rise of 50 millimeters per year lasting several centuries.• The potentially sensitive regions for rapid changes in ice volume are those with ice masses groundedbelow sea level such as the West Antarctic Ice Sheet, with 5 to 6 meters sea level equivalent, or largeglaciers in Greenland like the Jakobshavn Isbræ, also known as Jakobshavn Glacier and Sermeq Kujalleq(in Greenlandic), with an over-deepened channel (channel below sea level, see Figure 2.10) reaching farinland; total breakup of Jakobshavn Isbræ ice tongue in Greenland, as well as other tidewater glaciersand ice cap outlets, was preceded by its very rapid thinning.29


