The U.S. <strong>Climate</strong> <strong>Change</strong> <strong>Science</strong> <strong>Program</strong> Chapter 5Box 5.3. High-Latitude Terrestrial FeedbacksIn recent decades, the Arctic has witnessed startling environmental change. The changes span many facets of the arcticsystem including rapidly decreasing sea-ice extent, melting glaciers, warming and degrading permafrost, increasing runoffto the Arctic Ocean, expanding shrub cover, and important changes to the carbon balance (Serreze et al., 2000; Hassol,2004; Hinzman et al., 2005). The observed environmental trends are driven largely by temperatures that are increasingacross the Arctic at roughly twice the rate of the rest of the world (Serreze and Francis, 2006). If the arctic warming continuesand accelerates, as is predicted by all global climate models (Chapman and Walsh, 2007), it may invoke a number offeedbacks that have the potential to alter and possibly accelerate arctic and global climate change. If the feedbacks operateconstructively, even relatively small changes in the Arctic could conspire to amplify global climate change. Continued environmentalchange, especially if it occurs rapidly, is likely to have adverse consequences for highly vulnerable arctic and globalecosystems and negative impacts on human activities, including costly damage to infrastructure, particularly in the Arctic.The Arctic can influence global climate through both positive and negative feedbacks (Fig. 5.15). For example, sea-ice retreatreduces surface albedo, enhances absorption of solar radiation, and ultimately leads to greater pan-Arctic warming.Large-scale thawing of permafrost alters soil structural (thermokarst) and hydrologic properties (Jorgenson et al., 2001)with additional effects on the spatial extent of lakes and wetlands (Smith et al., 2005; Riordan et al., 2006), runoff to theArctic Ocean, ecosystem functioning (Jorgenson et al., 2001; Payette et al., 2004), and the surface energy balance. Warmingis also expected to enhance decomposition of soil organic matter, releasing carbon to the atmosphere (a positive feedback)(Zimov et al., 2006) and also releasing nitrogen which, in nutrient-limited arctic ecosystems, may prompt shrub growth(a negative feedback due to carbon sequestration) (Sturm et al., 2001). This greening-of-the-Arctic negative feedback mayitself be offset by a positive radiative feedback related to lower summer and especially winter albedos of shrubs and treesrelative to tundra (Chapin et al., 2005), which promotes an earlier spring snowmelt that among other things affects soiltemperature and permafrost (Sturm et al., 2001).The future of the Arctic as a net sink or source of carbon to the atmosphere depends on the delicate balance betweencarbon losses through enhanced soil decomposition and carbon gains to the ecosystem related to the greening of the Arctic(McGuire et al., 2006). Irrespective of the carbon balance, anticipated increases in methane emissions mean that the Arcticis likely to be an effective greenhouse gas source (Friborg et al., 2003; McGuire et al., 2006).The Arctic is a complex and interwoven system. On the basis of recent evidence of change, it appears that many of theseprocesses are already operating. Whether or not the positive or negative feedbacks will dominate is a critical questionfacing climate science. In a recent paper reviewing the integrated regional changes in arctic climate feedbacks, McGuire etal. (2006) conclude that the balance of evidence indicates that the positive feedbacks to global warming will likely dominateover the next century, but their relationship to global climate change remains difficult to predict, especially since much ofthe research to date has considered these feedbacks in isolation.198
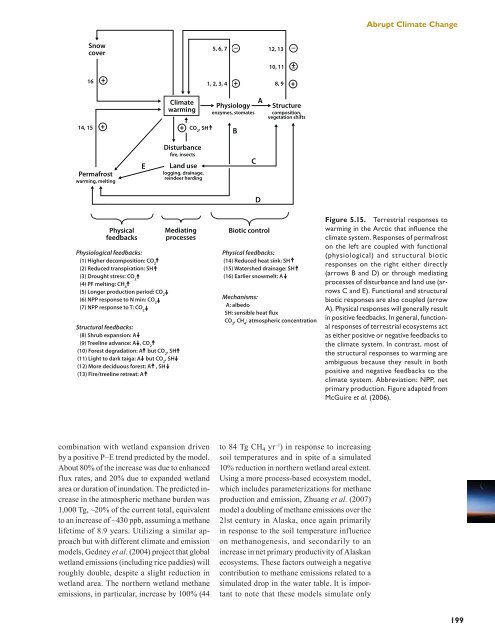
Abrupt <strong>Climate</strong> <strong>Change</strong>Snowcover5, 6, 7–12, 13–10, 11+–16+1, 2, 3, 4+ 8, 9 +14, 15<strong>Climate</strong>warming+ +CO 2, SHPhysiologyenzymes, stomatesBAStructurecomposition,vegetation shiftsPermafrostwarming, meltingEDisturbancefire, insectsLand uselogging, drainage,reindeer herdingCDPhysicalfeedbacksMediatingprocessesBiotic controlPhysiological feedbacks:Physical feedbacks:(1) Higher decomposition: CO 2(2) Reduced transpiration: SH(3) Drought stress: CO 2(4) PF melting: CH 4(5) Longer production period: CO 2(6) NPP response to N min: CO Mechanisms:2(7) NPP response to T: CO 2Structural feedbacks:(8) Shrub expansion: A(9) Treeline advance: A , CO 2(10) Forest degradation: A but CO 2, SH(11) Light to dark taiga: A but CO 2, SH(12) More deciduous forest: A , SH(13) Fire/treeline retreat: A(14) Reduced heat sink: SH(15) Watershed drainage: SH(16) Earlier snowmelt: AA: albedoSH: sensible heat fluxCO 2, CH 4: atmospheric concentrationFigure 5.15. Terrestrial responses towarming in the Arctic that influence theclimate system. Responses of permafroston the left are coupled with functional(physiological) and structural bioticresponses on the right either directly(arrows B and D) or through mediatingprocesses of disturbance and land use (arrowsC and E). Functional and structuralbiotic responses are also coupled (arrowA). Physical responses will generally resultin positive feedbacks. In general, functionalresponses of terrestrial ecosystems actas either positive or negative feedbacks tothe climate system. In contrast, most ofthe structural responses to warming areambiguous because they result in bothpositive and negative feedbacks to theclimate system. Abbreviation: NPP, netprimary production. Figure adapted fromMcGuire et al. (2006).combination with wetland expansion drivenby a positive P–E trend predicted by the model.About 80% of the increase was due to enhancedflux rates, and 20% due to expanded wetlandarea or duration of inundation. The predicted increasein the atmospheric methane burden was1,000 Tg, ~20% of the current total, equivalentto an increase of ~430 ppb, assuming a methanelifetime of 8.9 years. Utilizing a similar approachbut with different climate and emissionmodels, Gedney et al. (2004) project that globalwetland emissions (including rice paddies) willroughly double, despite a slight reduction inwetland area. The northern wetland methaneemissions, in particular, increase by 100% (44to 84 Tg CH 4 yr –1 ) in response to increasingsoil temperatures and in spite of a simulated10% reduction in northern wetland areal extent.Using a more process-based ecosystem model,which includes parameterizations for methaneproduction and emission, Zhuang et al. (2007)model a doubling of methane emissions over the21st century in Alaska, once again primarilyin response to the soil temperature influenceon methanogenesis, and secondarily to anincrease in net primary productivity of Alaskanecosystems. These factors outweigh a negativecontribution to methane emissions related to asimulated drop in the water table. It is importantto note that these models simulate only199