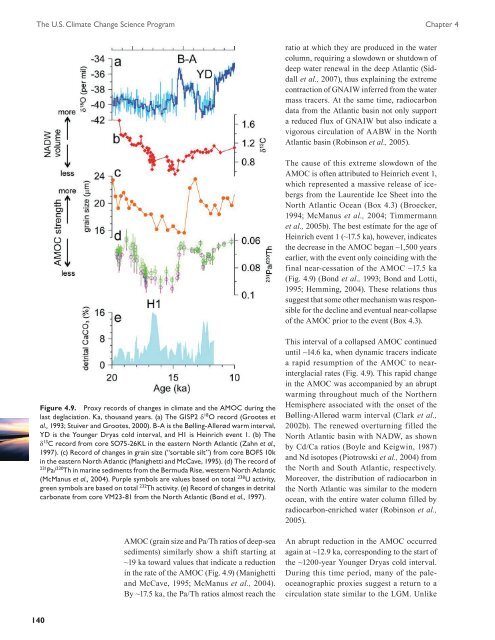
The U.S. <strong>Climate</strong> <strong>Change</strong> <strong>Science</strong> <strong>Program</strong> Chapter 4ratio at which they are produced in the watercolumn, requiring a slowdown or shutdown ofdeep water renewal in the deep Atlantic (Siddallet al., 2007), thus explaining the extremecontraction of GNAIW inferred from the watermass tracers. At the same time, radiocarbondata from the Atlantic basin not only supporta reduced flux of GNAIW but also indicate avigorous circulation of AABW in the NorthAtlantic basin (Robinson et al., 2005).The cause of this extreme slowdown of theAMOC is often attributed to Heinrich event 1,which represented a massive release of icebergsfrom the Laurentide Ice Sheet into theNorth Atlantic Ocean (Box 4.3) (Broecker,1994; McManus et al., 2004; Timmermannet al., 2005b). The best estimate for the age ofHeinrich event 1 (~17.5 ka), however, indicatesthe decrease in the AMOC began ~1,500 yearsearlier, with the event only coinciding with thefinal near-cessation of the AMOC ~17.5 ka(Fig. 4.9) (Bond et al., 1993; Bond and Lotti,1995; Hemming, 2004). These relations thussuggest that some other mechanism was responsiblefor the decline and eventual near-collapseof the AMOC prior to the event (Box 4.3).Figure 4.9. Proxy records of changes in climate and the AMOC during thelast deglaciation. Ka, thousand years. (a) The GISP2 δ 18 O record (Grootes etal., 1993; Stuiver and Grootes, 2000). B-A is the Bølling-Allerød warm interval,YD is the Younger Dryas cold interval, and H1 is Heinrich event 1. (b) Theδ 13 C record from core SO75-26KL in the eastern North Atlantic (Zahn et al.,1997). (c) Record of changes in grain size (“sortable silt”) from core BOFS 10kin the eastern North Atlantic (Manighetti and McCave, 1995). (d) The record of231 Pa/ 230 Th in marine sediments from the Bermuda Rise, western North Atlantic(McManus et al., 2004). Purple symbols are values based on total 238 U activity,green symbols are based on total 232 Th activity. (e) Record of changes in detritalcarbonate from core VM23-81 from the North Atlantic (Bond et al., 1997).AMOC (grain size and Pa/Th ratios of deep-seasediments) similarly show a shift starting at~19 ka toward values that indicate a reductionin the rate of the AMOC (Fig. 4.9) (Manighettiand McCave, 1995; McManus et al., 2004).By ~17.5 ka, the Pa/Th ratios almost reach theThis interval of a collapsed AMOC continueduntil ~14.6 ka, when dynamic tracers indicatea rapid resumption of the AMOC to nearinterglacialrates (Fig. 4.9). This rapid changein the AMOC was accompanied by an abruptwarming throughout much of the NorthernHemisphere associated with the onset of theBølling-Allerød warm interval (Clark et al.,2002b). The renewed overturning filled theNorth Atlantic basin with NADW, as shownby Cd/Ca ratios (Boyle and Keigwin, 1987)and Nd isotopes (Piotrowski et al., 2004) fromthe North and South Atlantic, respectively.Moreover, the distribution of radiocarbon inthe North Atlantic was similar to the modernocean, with the entire water column filled byradiocarbon-enriched water (Robinson et al.,2005).An abrupt reduction in the AMOC occurredagain at ~12.9 ka, corresponding to the start ofthe ~1200-year Younger Dryas cold interval.During this time period, many of the paleoceanographicproxies suggest a return to acirculation state similar to the LGM. Unlike140
Abrupt <strong>Climate</strong> <strong>Change</strong>Box 4.3. Past Mechanisms for Freshwater Forcing of the AMOCIce sheets represent the largest readily exchangeable reservoir of freshwater on Earth. Given the proximity of modernand former ice sheets to critical sites of intermediate and deep water formation (Fig. 4.1), variations in their freshwaterfluxes thus have the potential to induce changes in the AMOC. In this regard, the paleorecord has suggested four specificmechanisms by which ice sheets may rapidly discharge freshwater to the surrounding oceans and cause abrupt changes inthe AMOC: (1) Heinrich events, (2) meltwater pulses, (3) routing events, and (4) floods.1. Heinrich events are generally thought to represent an ice-sheet instability resulting in abrupt release of icebergsthat triggers a large reduction in the AMOC. Paleoclimate records, however, indicate that Heinrich events occurafter the AMOC has slowed down or largely collapsed. An alternative explanation is that Heinrich events are triggeredby an ice-shelf collapse induced by subsurface oceanic warming that develops when the AMOC collapses,with the resulting flux of icebergs acting to sustain the reduced AMOC.2. The ~20-m sea-level rise ~14,500 years ago, commonly referred to as meltwater pulse (MWP) 1A, indicates anextraordinary episode of ice-sheet collapse, with an associated freshwater flux to the ocean of ~0.5 Sv over severalhundred years (see Chapter 2). Nevertheless, the timing, source, and the effect on climate of MWP-1A remainunclear. In one scenario, the event was triggered by an abrupt warming (start of the Bølling warm interval) inthe North Atlantic region, causing widespread melting of Northern Hemisphere ice sheets. Although this eventrepresents the largest freshwater forcing yet identified from paleo-sea-level records, there was little responseby the AMOC, leading to the conclusion that the meltwater entered the ocean as a sediment-laden, very densebottom flow, thus reducing its impact on the AMOC. In another scenario, MWP-1A largely originated from theAntarctic Ice Sheet, possibly in response to the prolonged interval of warming in the Southern Hemispherethat preceded the event. In this case, climate model simulations indicate that the freshwater perturbation in theSouthern Ocean may have triggered the resumption of the AMOC that caused the Bølling warm interval.3. The most well-known hypothesis for a routing event involves retreat of the Laurentide Ice Sheet (LIS) that redirectedcontinental runoff from the Mississippi to the St. Lawrence River, triggering the Younger Dryas cold interval.There is clear paleoceanographic evidence for routing of freshwater away from the Mississippi River at the startof the Younger Dryas, and recent paleoceanographic evidence now clearly shows a large salinity decrease in theSt. Lawrence estuary at the start of the Younger Dryas associated with an increased freshwater flux derived fromwestern Canada.4. The most well-known flood is the final sudden drainage of glacial Lake Agassiz that is generally considered to bethe cause of an abrupt climate change ~8400 years ago. For this event, the freshwater forcing was likely large butshort; the best current estimate suggests a freshwater flux of 4–9 Sv over 0.5 year. This event was unique to thelast stages of the LIS, however, and similar such events should only be expected in association with similar suchice-sheet configurations. Other floods have been inferred at other times, but they would have been much smaller(~0.3 Sv in 1 year), and model simulations suggest they would have had a negligible impact on the AMOC.the near-collapse earlier in the deglaciationat ~17.5 ka, for example, Pa/Th ratios suggestonly a partial reduction in the AMOC duringthe Younger Dryas (Fig. 4.9). Sediment grainsize (Manighetti and McCave, 1995) alsoshows evidence for reduced NADW input intothe North Atlantic during the Younger Dryasevent (Fig. 4.9). Radiocarbon concentration inthe atmosphere rises at the start of the YoungerDryas, which is thought to reflect decreasedocean uptake due to a slowdown of the AMOC(Hughen et al., 2000). Radiocarbon-depletedAABW replaced radiocarbon-enriched NADWbelow ~2500 m, suggesting a shoaling ofNADW coincident with a reduction of theAMOC (Keigwin, 2004). The δ 13 C valuesalso suggest a return to the LGM water massconfiguration (Sarnthein et al., 1994; Keigwin,2004), as do other nutrient tracers (Boyle andKeigwin, 1987) and the Nd isotope water masstracer (Piotrowski et al., 2005).141