The good prospects are based on the all-embracing ... - ALNO AG
The good prospects are based on the all-embracing ... - ALNO AG
The good prospects are based on the all-embracing ... - ALNO AG

Create successful ePaper yourself
Turn your PDF publications into a flip-book with our unique Google optimized e-Paper software.
36<br />
sinGLE-Entity and GRoup manaGEmEnt REpoRt | EC<strong>on</strong>omiC REpoRt<br />
vIII. resulTs of oPeraTIoNs, NeT asseTs aNd<br />
lIquIdITY<br />
General development of business<br />
<str<strong>on</strong>g>The</str<strong>on</strong>g> income statement for <strong>the</strong> <strong>ALNO</strong> Group (according to<br />
Internati<strong>on</strong>al Financial Reporting Standards) is <str<strong>on</strong>g>based</str<strong>on</strong>g> <strong>on</strong><br />
<strong>the</strong> nature of expense method.<br />
<str<strong>on</strong>g>The</str<strong>on</strong>g> <strong>ALNO</strong> Group's negative result in <strong>the</strong> period under<br />
review was attributable to several factors. In additi<strong>on</strong> to<br />
feeble export business, <strong>the</strong> introducti<strong>on</strong> of a new Wellmann<br />
range in <strong>the</strong> Enger plant, an inappropriate price<br />
policy launched in 2010 and higher prices for producti<strong>on</strong><br />
material, as well as higher transport costs <strong>all</strong> c<strong>on</strong>tributed<br />
to <strong>the</strong> negative result in <strong>the</strong> financial year 2011. While sales<br />
declined in relati<strong>on</strong> to <strong>the</strong> previous year, PINO was <strong>the</strong> <strong>on</strong>ly<br />
<strong>on</strong>e of <strong>the</strong> four Group brands to generate higher sales.<br />
sales and earnings<br />
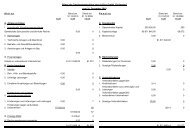
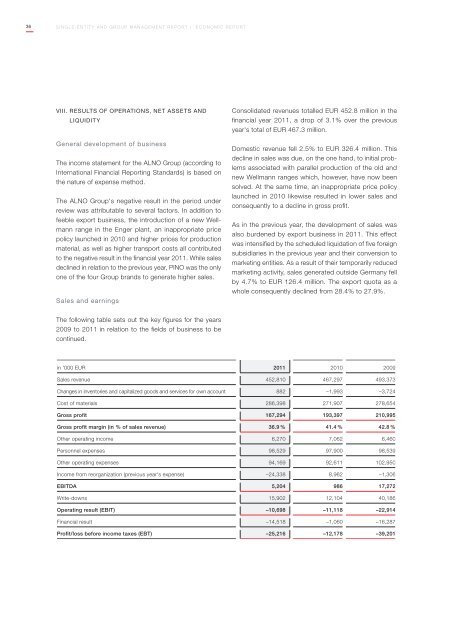
<str<strong>on</strong>g>The</str<strong>on</strong>g> following table sets out <strong>the</strong> key figures for <strong>the</strong> years<br />
2009 to 2011 in relati<strong>on</strong> to <strong>the</strong> fields of business to be<br />
c<strong>on</strong>tinued.<br />
C<strong>on</strong>solidated revenues tot<strong>all</strong>ed EUR 452.8 milli<strong>on</strong> in <strong>the</strong><br />
financial year 2011, a drop of 3.1% over <strong>the</strong> previous<br />
year's total of EUR 467.3 milli<strong>on</strong>.<br />
Domestic revenue fell 2.5% to EUR 326.4 milli<strong>on</strong>. This<br />
decline in sales was due, <strong>on</strong> <strong>the</strong> <strong>on</strong>e hand, to initial prob-<br />
lems associated with par<strong>all</strong>el producti<strong>on</strong> of <strong>the</strong> old and<br />
new Wellmann ranges which, however, have now been<br />
solved. At <strong>the</strong> same time, an inappropriate price policy<br />
launched in 2010 likewise resulted in lower sales and<br />
c<strong>on</strong>sequently to a decline in gross profit.<br />
As in <strong>the</strong> previous year, <strong>the</strong> development of sales was<br />
also burdened by export business in 2011. This effect<br />
was intensified by <strong>the</strong> scheduled liquidati<strong>on</strong> of five foreign<br />
subsidiaries in <strong>the</strong> previous year and <strong>the</strong>ir c<strong>on</strong>versi<strong>on</strong> to<br />
marketing entities. As a result of <strong>the</strong>ir temporarily reduced<br />
marketing activity, sales generated outside Germany fell<br />
by 4.7% to EUR 126.4 milli<strong>on</strong>. <str<strong>on</strong>g>The</str<strong>on</strong>g> export quota as a<br />
whole c<strong>on</strong>sequently declined from 28.4% to 27.9%.<br />
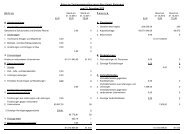
in '000 EUR 2011 2010 2009<br />
Sales revenue 452,810 467,297 493,373<br />
Changes in inventories and capitalized <str<strong>on</strong>g>good</str<strong>on</strong>g>s and services for own account 882 –1,993 –3,724<br />
Cost of materials 286,398 271,907 278,654<br />
Gross profit 167,294 193,397 210,995<br />
Gross profit margin (in % of sales revenue) 36.9 % 41.4 % 42.8 %<br />
O<strong>the</strong>r operating income 6,270 7,062 6,460<br />
Pers<strong>on</strong>nel expenses 98,529 97,900 98,539<br />
O<strong>the</strong>r operating expenses 94,169 92,611 102,950<br />
Income from reorganizati<strong>on</strong> (previous year's expense) –24,338 8,962 –1,306<br />
EBITDA 5,204 986 17,272<br />
Write-downs 15,902 12,104 40,186<br />
Operating result (EBIT) –10,698 –11,118 –22,914<br />
Financial result –14,518 –1,060 –16,287<br />
Profit/loss before income taxes (EBT) –25,216 –12,178 –39,201