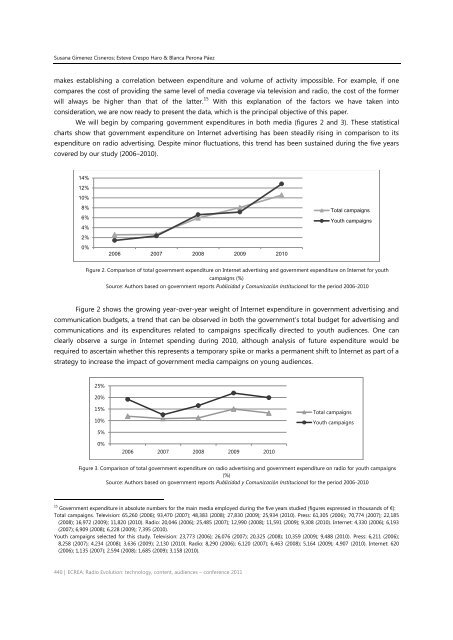
- Page 3 and 4:
© CECS 2012All rights reserved. No
- Page 5 and 6:
The development of the news-informa
- Page 7:
Music as mass consume in the web ra
- Page 10 and 11:
2 | ECREA: Radio Evolution: technol
- Page 12 and 13:
media, radio opened channels for di
- Page 14 and 15:
6 | ECREA: Radio Evolution: technol
- Page 16 and 17:
Luís BonixeWe analyzed the Faceboo
- Page 18 and 19:
Luís BonixeFinally, social network
- Page 20 and 21:
Luís BonixeMethodologyThe purpose
- Page 22 and 23:
Luís BonixeNews isbroadcast ontrad
- Page 24 and 25:
Luís BonixeMayfiled, Anthony (2008
- Page 26 and 27:
Tiziano Boninibody of the radio med
- Page 28 and 29:
Tiziano BoniniCase history #1: RaiT
- Page 30 and 31:
Tiziano BoniniPodcasts are easy to
- Page 32 and 33:
Tiziano BoniniSocial media Manifest
- Page 34 and 35:
Tiziano BoniniVol. No. 51 Issue No.
- Page 36 and 37:
Teresa Piñero-Otero & Fernando Ram
- Page 38 and 39:
Teresa Piñero-Otero & Fernando Ram
- Page 40 and 41:
Teresa Piñero-Otero & Fernando Ram
- Page 42 and 43:
Teresa Piñero-Otero & Fernando Ram
- Page 44 and 45:
Teresa Piñero-Otero & Fernando Ram
- Page 46 and 47:
Teresa Piñero-Otero & Fernando Ram
- Page 48 and 49:
Lawrie Hallettregulatory frameworks
- Page 50 and 51:
Lawrie Halletttend to remain somewh
- Page 52 and 53:
Lawrie Hallettduplicate that carrie
- Page 54 and 55:
Lawrie HallettNevertheless, given t
- Page 56 and 57:
Lawrie Hallett48 | ECREA: Radio Evo
- Page 58 and 59:
Susana Herrera Damas & José Luís
- Page 60 and 61:
Susana Herrera Damas & José Luís
- Page 62 and 63:
Susana Herrera Damas & José Luís
- Page 64 and 65:
Susana Herrera Damas & José Luís
- Page 66 and 67:
Susana Herrera Damas & José Luís
- Page 68 and 69:
Susana Herrera Damas & José Luís
- Page 70 and 71:
Susana Herrera Damas & José Luís
- Page 72 and 73:
Título del ejePercentageMaria Guti
- Page 74 and 75:
Maria Gutiérrez; Xavi Ribes; Josep
- Page 76 and 77:
Maria Gutiérrez; Xavi Ribes; Josep
- Page 78 and 79:
Maria Gutiérrez; Xavi Ribes; Josep
- Page 80 and 81:
Maria Gutiérrez; Xavi Ribes; Josep
- Page 82 and 83:
CorporativaFlaix matíInteractuaCor
- Page 84 and 85:
Maria Gutiérrez; Xavi Ribes; Josep
- Page 86 and 87:
Maria Gutiérrez; Xavi Ribes; Josep
- Page 88 and 89:
Pierre BélangerThe Canadian Radios
- Page 90 and 91:
Pierre BélangerFigure 1: Astral's
- Page 92 and 93:
Pierre BélangerFor both traditiona
- Page 94 and 95:
Pierre Bélangerbrand(s), he has fi
- Page 96 and 97:
Pierre BélangerFigure 5: Digital S
- Page 98 and 99:
Pierre BélangerAlthough the online
- Page 100 and 101:
Pierre BélangerLeggatt, H. (2010).
- Page 102 and 103:
Pierre Bélanger94 | ECREA: Radio E
- Page 104 and 105:
Hélder Bastos; Helena Lima; Nuno M
- Page 106 and 107:
Hélder Bastos; Helena Lima; Nuno M
- Page 108 and 109:
Hélder Bastos; Helena Lima; Nuno M
- Page 110 and 111:
Hélder Bastos; Helena Lima; Nuno M
- Page 112 and 113:
Hélder Bastos; Helena Lima; Nuno M
- Page 115 and 116:
Radio journalists and the Internet:
- Page 117 and 118:
Oliveira, M.; Portela, P. & Santos,
- Page 119 and 120:
Casting doubts on Web Media. Can In
- Page 121 and 122:
Casting doubts on Web Media. Can In
- Page 123 and 124:
19919293949596979899200001020304050
- Page 125 and 126:
Casting doubts on Web Media. Can In
- Page 127 and 128:
Casting doubts on Web Media. Can In
- Page 129 and 130:
Casting doubts on Web Media. Can In
- Page 131 and 132:
Oliveira, M.; Portela, P. & Santos,
- Page 133 and 134:
The development of the news-informa
- Page 135 and 136:
The development of the news-informa
- Page 137 and 138:
The development of the news-informa
- Page 139 and 140:
The development of the news-informa
- Page 141 and 142:
Oliveira, M.; Portela, P. & Santos,
- Page 143 and 144:
Digital radio in Brazil: analysis o
- Page 145 and 146:
Digital radio in Brazil: analysis o
- Page 147 and 148:
Digital radio in Brazil: analysis o
- Page 149 and 150:
Digital radio in Brazil: analysis o
- Page 151 and 152:
Digital radio in Brazil: analysis o
- Page 153 and 154:
Digital radio in Brazil: analysis o
- Page 155 and 156:
Oliveira, M.; Portela, P. & Santos,
- Page 157 and 158:
From Radio to R@dio: broadcasting i
- Page 159 and 160:
From Radio to R@dio: broadcasting i
- Page 161 and 162:
From Radio to R@dio: broadcasting i
- Page 163 and 164:
From Radio to R@dio: broadcasting i
- Page 165 and 166:
From Radio to R@dio: broadcasting i
- Page 167 and 168:
Oliveira, M.; Portela, P. & Santos,
- Page 169 and 170:
Live and local no more? Listening c
- Page 171 and 172:
Live and local no more? Listening c
- Page 173 and 174:
Live and local no more? Listening c
- Page 175 and 176:
Live and local no more? Listening c
- Page 177 and 178:
Live and local no more? Listening c
- Page 179 and 180:
Oliveira, M.; Portela, P. & Santos,
- Page 181 and 182:
Local broadcasters in the convergen
- Page 183 and 184:
Local broadcasters in the convergen
- Page 185 and 186:
Local broadcasters in the convergen
- Page 187 and 188:
Local broadcasters in the convergen
- Page 189 and 190:
Local broadcasters in the convergen
- Page 191 and 192:
Local broadcasters in the convergen
- Page 193 and 194:
Local broadcasters in the convergen
- Page 195 and 196:
Local broadcasters in the convergen
- Page 197 and 198:
Oliveira, M.; Portela, P. & Santos,
- Page 199 and 200:
The ways of participation. The volu
- Page 201 and 202:
The ways of participation. The volu
- Page 203 and 204:
The ways of participation. The volu
- Page 205 and 206:
The ways of participation. The volu
- Page 207 and 208:
Oliveira, M.; Portela, P. & Santos,
- Page 209 and 210:
Influences of Political Economy on
- Page 211 and 212:
Influences of Political Economy on
- Page 213 and 214:
Influences of Political Economy on
- Page 215 and 216:
Oliveira, M.; Portela, P. & Santos,
- Page 217 and 218:
Euranet: a Case of Study of Pan-Eur
- Page 219 and 220:
Euranet: a Case of Study of Pan-Eur
- Page 221 and 222:
Euranet: a Case of Study of Pan-Eur
- Page 223 and 224:
Euranet: a Case of Study of Pan-Eur
- Page 225 and 226:
Euranet: a Case of Study of Pan-Eur
- Page 227 and 228:
Part II :ContentChapter 3 | New rad
- Page 229 and 230:
Oliveira, M.; Portela, P. & Santos,
- Page 231 and 232:
Changes in Patterns of contemporary
- Page 233 and 234:
Changes in Patterns of contemporary
- Page 235 and 236:
Changes in Patterns of contemporary
- Page 237 and 238:
Changes in Patterns of contemporary
- Page 239 and 240:
Oliveira, M.; Portela, P. & Santos,
- Page 241 and 242:
The French highway radio: a model f
- Page 243 and 244:
Oliveira, M.; Portela, P. & Santos,
- Page 245 and 246:
Band FM of Journalism of São Paulo
- Page 247 and 248:
Band FM of Journalism of São Paulo
- Page 249 and 250:
Band FM of Journalism of São Paulo
- Page 251 and 252:
Band FM of Journalism of São Paulo
- Page 253 and 254:
Band FM of Journalism of São Paulo
- Page 255 and 256:
Oliveira, M.; Portela, P. & Santos,
- Page 257 and 258:
Radiographing an ‘Expatriate’ S
- Page 259 and 260:
Radiographing an ‘Expatriate’ S
- Page 261 and 262:
Radiographing an ‘Expatriate’ S
- Page 263 and 264:
Radiographing an ‘Expatriate’ S
- Page 265 and 266:
Radiographing an ‘Expatriate’ S
- Page 267 and 268:
Radiographing an ‘Expatriate’ S
- Page 269 and 270:
Oliveira, M.; Portela, P. & Santos,
- Page 271 and 272:
Radio today: the risks of the past
- Page 273 and 274:
Radio today: the risks of the past
- Page 275 and 276:
Radio today: the risks of the past
- Page 277 and 278:
Radio today: the risks of the past
- Page 279 and 280:
Radio today: the risks of the past
- Page 281 and 282:
Oliveira, M.; Portela, P. & Santos,
- Page 283 and 284:
Romeo in love: a community format i
- Page 285 and 286:
Romeo in love: a community format i
- Page 287 and 288:
Romeo in love: a community format i
- Page 289 and 290:
Romeo in love: a community format i
- Page 291 and 292:
Romeo in love: a community format i
- Page 293 and 294:
Romeo in love: a community format i
- Page 295 and 296:
Oliveira, M.; Portela, P. & Santos,
- Page 297 and 298:
Creativity: the key to creating suc
- Page 299 and 300:
Creativity: the key to creating suc
- Page 301 and 302:
Creativity: the key to creating suc
- Page 303 and 304:
Creativity: the key to creating suc
- Page 305 and 306:
Oliveira, M.; Portela, P. & Santos,
- Page 307 and 308:
Advertising characteristics and str
- Page 309 and 310:
Advertising characteristics and str
- Page 311 and 312:
Advertising characteristics and str
- Page 313 and 314:
Advertising characteristics and str
- Page 315 and 316:
Advertising characteristics and str
- Page 317 and 318:
Advertising characteristics and str
- Page 319 and 320:
Oliveira, M.; Portela, P. & Santos,
- Page 321 and 322:
Description and analysis of adverti
- Page 323 and 324:
Description and analysis of adverti
- Page 325 and 326:
Description and analysis of adverti
- Page 327 and 328:
Description and analysis of adverti
- Page 329 and 330:
Chapter 4 | Non-Linear discourseand
- Page 331 and 332:
Oliveira, M.; Portela, P. & Santos,
- Page 333 and 334:
Radio - the forgotten medium or use
- Page 335 and 336:
Radio - the forgotten medium or use
- Page 337 and 338:
Radio - the forgotten medium or use
- Page 339 and 340:
Radio - the forgotten medium or use
- Page 341 and 342:
Radio - the forgotten medium or use
- Page 343 and 344:
Radio - the forgotten medium or use
- Page 345 and 346:
Oliveira, M.; Portela, P. & Santos,
- Page 347 and 348:
One Half of the Story: Radio Drama,
- Page 349 and 350:
One Half of the Story: Radio Drama,
- Page 351 and 352:
One Half of the Story: Radio Drama,
- Page 353 and 354:
One Half of the Story: Radio Drama,
- Page 355 and 356:
One Half of the Story: Radio Drama,
- Page 357 and 358:
Oliveira, M.; Portela, P. & Santos,
- Page 359 and 360:
Formal or informal ‘you’? ‘Vo
- Page 361 and 362:
Formal or informal ‘you’? ‘Vo
- Page 363 and 364:
Formal or informal ‘you’? ‘Vo
- Page 365 and 366:
Oliveira, M.; Portela, P. & Santos,
- Page 367 and 368:
Democratic barricades: the presence
- Page 369 and 370:
Democratic barricades: the presence
- Page 371 and 372:
Democratic barricades: the presence
- Page 373 and 374:
Democratic barricades: the presence
- Page 375 and 376:
Part II :AudiencesChapter 5 | New M
- Page 377 and 378:
Oliveira, M.; Portela, P. & Santos,
- Page 379 and 380:
Measuring Community Radio Audiences
- Page 381 and 382:
Measuring Community Radio Audiences
- Page 383 and 384:
Measuring Community Radio Audiences
- Page 385 and 386:
Measuring Community Radio Audiences
- Page 387 and 388:
Oliveira, M.; Portela, P. & Santos,
- Page 389 and 390:
‘I know exactly who they are’:
- Page 391 and 392:
‘I know exactly who they are’:
- Page 393 and 394:
‘I know exactly who they are’:
- Page 395 and 396:
‘I know exactly who they are’:
- Page 397 and 398: ‘I know exactly who they are’:
- Page 399 and 400: Chapter 6 | Radio Globalizationand
- Page 401 and 402: Oliveira, M.; Portela, P. & Santos,
- Page 403 and 404: The Radio’s afterlife. Three sphe
- Page 405 and 406: The Radio’s afterlife. Three sphe
- Page 407 and 408: The Radio’s afterlife. Three sphe
- Page 409 and 410: The Radio’s afterlife. Three sphe
- Page 411 and 412: The Radio’s afterlife. Three sphe
- Page 413 and 414: Oliveira, M.; Portela, P. & Santos,
- Page 415 and 416: Radio and the Web: BBC radio as a n
- Page 417 and 418: Radio and the Web: BBC radio as a n
- Page 419 and 420: Radio and the Web: BBC radio as a n
- Page 421 and 422: Oliveira, M.; Portela, P. & Santos,
- Page 423 and 424: University radio stations in Brazil
- Page 425 and 426: University radio stations in Brazil
- Page 427 and 428: University radio stations in Brazil
- Page 429 and 430: Oliveira, M.; Portela, P. & Santos,
- Page 431 and 432: Brazilian Auditorium Programs and Q
- Page 433 and 434: Brazilian Auditorium Programs and Q
- Page 435 and 436: Brazilian Auditorium Programs and Q
- Page 437 and 438: Brazilian Auditorium Programs and Q
- Page 439 and 440: Oliveira, M.; Portela, P. & Santos,
- Page 441 and 442: Breaking Radio Boundaries: a new en
- Page 443 and 444: Breaking Radio Boundaries: a new en
- Page 445 and 446: Breaking Radio Boundaries: a new en
- Page 447: Breaking Radio Boundaries: a new en
- Page 451 and 452: Breaking Radio Boundaries: a new en
- Page 453 and 454: Breaking Radio Boundaries: a new en
- Page 455 and 456: Oliveira, M.; Portela, P. & Santos,
- Page 457 and 458: Music as mass consume in the web ra
- Page 459 and 460: Music as mass consume in the web ra
- Page 461 and 462: Music as mass consume in the web ra
- Page 463 and 464: Part II :IdentityChapter 7 | Identi
- Page 465 and 466: Oliveira, M.; Portela, P. & Santos,
- Page 467 and 468: Internet radio as a mean to constru
- Page 469 and 470: Internet radio as a mean to constru
- Page 471 and 472: Internet radio as a mean to constru
- Page 473 and 474: Internet radio as a mean to constru
- Page 475 and 476: Oliveira, M.; Portela, P. & Santos,
- Page 477 and 478: Free, Pirate, Community - the repre
- Page 479 and 480: Free, Pirate, Community - the repre
- Page 481 and 482: Free, Pirate, Community - the repre
- Page 483 and 484: Free, Pirate, Community - the repre
- Page 485 and 486: Oliveira, M.; Portela, P. & Santos,
- Page 487 and 488: Radio, Citizenship and Social Ident
- Page 489 and 490: Radio, Citizenship and Social Ident
- Page 491 and 492: Radio, Citizenship and Social Ident
- Page 493 and 494: Radio, Citizenship and Social Ident
- Page 495 and 496: Oliveira, M.; Portela, P. & Santos,
- Page 497 and 498: The German-speaking radio in Silesi
- Page 499 and 500:
The German-speaking radio in Silesi
- Page 501 and 502:
The German-speaking radio in Silesi
- Page 503 and 504:
Oliveira, M.; Portela, P. & Santos,
- Page 505 and 506:
Basque and Gael speaking radio jour
- Page 507 and 508:
Basque and Gael speaking radio jour
- Page 509 and 510:
Basque and Gael speaking radio jour
- Page 511 and 512:
Oliveira, M.; Portela, P. & Santos,
- Page 513 and 514:
Antonio AdamiThe radio in Brazil wa
- Page 515 and 516:
Antonio AdamiFigure 1: Relação da
- Page 517 and 518:
Antonio Adamipublished in February
- Page 519 and 520:
Antonio Adami1929 - São PauloPRB-9
- Page 521 and 522:
Antonio Adamione big auditorium and