2010 - Embraco
2010 - Embraco
2010 - Embraco

Create successful ePaper yourself
Turn your PDF publications into a flip-book with our unique Google optimized e-Paper software.
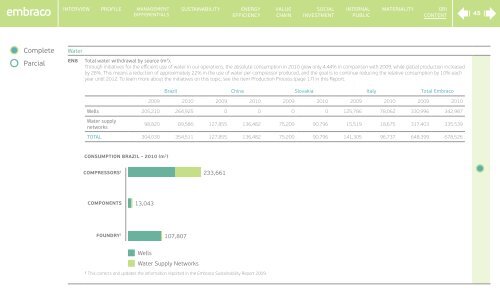
Interview Profile ManagementdifferentialsSustainaBIlityEnergyEffICIencySupply valuechain ChaINSoCIalinvestmentInternalPublICMATERIalItyGRIContent45CompleteParcialWaterEN8 Total water withdrawal by source (m 3 ).Through initiatives for the efficient use of water in our operations, the absolute consumption in <strong>2010</strong> grew only 4.44% in comparison with 2009, while global production increasedby 28%. This means a reduction of approximately 22% in the use of water per compressor produced, and the goal is to continue reducing the relative consumption by 10% eachyear until 2012. To learn more about the initiatives on this topic, see the item Production Process (page 17) in this Report.Brazil China Slovakia Italy Total <strong>Embraco</strong>2009 <strong>2010</strong> 2009 <strong>2010</strong> 2009 <strong>2010</strong> 2009 <strong>2010</strong> 2009 <strong>2010</strong>Wells 205,210 264,925 0 0 0 0 125,786 78,062 330,996 342,987Water supplynetworks98,820 89,586 127,855 136,482 75,209 90,796 15,519 18,675 317,403 335,539total 304,030 354,511 127,855 136,482 75,209 90,796 141,305 96,737 648,399 678,526Consumption bRazil – <strong>2010</strong> (m 3 )CompreSSoRS 1233,661Foundry 1 107,807Components 13,043WellsWater Supply Networks1This corrects and updates the information reported in the <strong>Embraco</strong> Sustainability Report 2009.