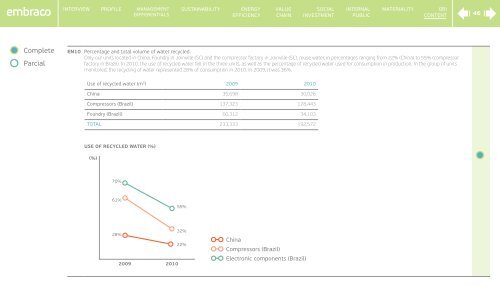
Interview Profile ManagementdifferentialsSustainaBIlityEnergyEffICIencySupply valuechain ChaINSoCIalinvestmentInternalPublICMATERIalItyGRIContent46CompleteParcialEN10 Percentage and total volume of water recycled.Only our units located in China, Foundry in Joinville (SC) and the compressor factory in Joinville (SC), reuse water, in percentages ranging from 22% (China) to 55% (compressorfactory in Brazil). In <strong>2010</strong>, the use of recycled water fell in the three units, as well as the percentage of recycled water used for consumption in production. In the group of unitsmonitored, the recycling of water represented 28% of consumption in <strong>2010</strong>. In 2009, it was 36%.Use of recycled water (m 3 ) 2009 <strong>2010</strong>China 35,698 30,026Compressors (Brazil) 137,323 128,443Foundry (Brazil) 60,312 34,103total 233,333 192,572Use of recycled water (%)(%)70%61%55%28%2009<strong>2010</strong>32%22%ChinaCompressors (Brazil)Electronic components (Brazil)
Discharge total (m 3 ) 1 Brazil China Slovakia Italy Total <strong>Embraco</strong>Discharge in Brazil (m 3 ) 1 Compressors Components FoundryInterview Profile ManagementdifferentialsSustainaBIlityEnergyEffICIencySupply valuechain ChaINSoCIalinvestmentInternalPublICMATERIalItyGRIContent47CompleteParcialEmissions, Effluents, and WasteEN21 Total water discharge by quality and destination.Following the consumption profiles, the water discharge is higher in the compressor factory located in Brazil. In <strong>2010</strong>, 233,590 m³ were discharged, of which 55% for recycling inthe effluent treatment process.In all units, we invested in the treatment of waste water, and therefore, the discharge is done mostly at the collection point, according to the following table.2009 <strong>2010</strong> 2009 <strong>2010</strong> 2009 <strong>2010</strong> 2009 <strong>2010</strong> 2009 <strong>2010</strong>Discharge to collection point 115,550 136,114 89,243 103,726 0 69,325 134,240 91,900 339,033 401,065Public Sewer Systems 0 0 0 0 75,209 0 0 0 75,209 0Evaporation 66,725 45,086 1,279 0 0 0 7,065 4,837 75,069 49,924Irrigation 0 0 1,662 3,139 0 0 0 0 1,662 3,139Recycling (from processeffluent treatment)121,754 169,410 35,672 29,617 0 0 0 0 157,426 199,027total 304,028 350,610 127,855 136,482 75,209 69,325 141,305 96,737 648,399 653,1551Estimate based on water consumption.The following table provides detailed information on the water disposal in the three units located in Brazil, with variations due to differences in the types of business.2009 <strong>2010</strong> 2009 <strong>2010</strong> 2009 <strong>2010</strong>Discharge to collection point 56,821 72,435 6,423 6,541 52,306 57,138Public Sewer Systems 0 0 0 0 0 0Evaporation 54,862 32,712 2,981 2,672 8,882 9,702Irrigation 0 0 0 0 0 0Recycling (from process effluenttreatment)84,252 128,443 0 0 37,502 40,967total 195,935 233,590 9,404 9,213 98,690 107,8071Estimate based on water consumption.