Financial - Turkish Airlines
Financial - Turkish Airlines
Financial - Turkish Airlines
- No tags were found...

Create successful ePaper yourself
Turn your PDF publications into a flip-book with our unique Google optimized e-Paper software.
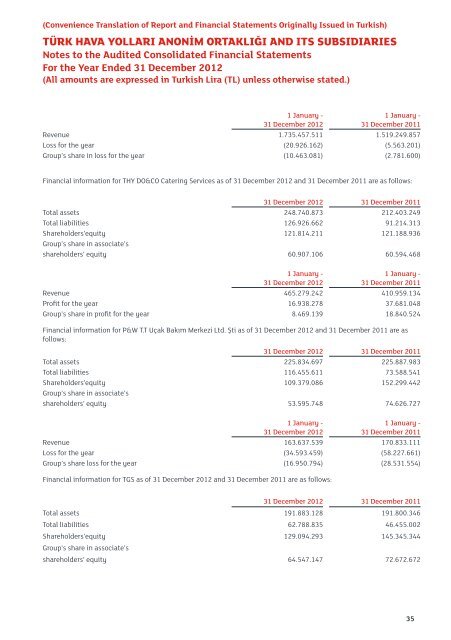
(Convenience Translation of Report and <strong>Financial</strong> Statements Originally Issued in <strong>Turkish</strong>)TÜRK HAVA YOLLARI ANONİM ORTAKLIĞI AND ITS SUBSIDIARIESNotes to the Audited Consolidated <strong>Financial</strong> StatementsFor the Year Ended 31 December 2012(All amounts are expressed in <strong>Turkish</strong> Lira (TL) unless otherwise stated.)1 January -31 December 20121 January -31 December 2011Revenue 1.735.457.511 1.519.249.857Loss for the year (20.926.162) (5.563.201)Group’s share in loss for the year (10.463.081) (2.781.600)<strong>Financial</strong> information for THY DO&CO Catering Services as of 31 December 2012 and 31 December 2011 are as follows:31 December 2012 31 December 2011Total assets 248.740.873 212.403.249Total liabilities 126.926.662 91.214.313Shareholders’equity 121.814.211 121.188.936Group’s share in associate’sshareholders’ equity 60.907.106 60.594.4681 January -31 December 20121 January -31 December 2011Revenue 465.279.242 410.959.134Profit for the year 16.938.278 37.681.048Group’s share in profit for the year 8.469.139 18.840.524<strong>Financial</strong> information for P&W T.T Uçak Bakım Merkezi Ltd. Şti as of 31 December 2012 and 31 December 2011 are asfollows:31 December 2012 31 December 2011Total assets 225.834.697 225.887.983Total liabilities 116.455.611 73.588.541Shareholders’equity 109.379.086 152.299.442Group’s share in associate’sshareholders’ equity 53.595.748 74.626.7271 January -31 December 20121 January -31 December 2011Revenue 163.637.539 170.833.111Loss for the year (34.593.459) (58.227.661)Group’s share loss for the year (16.950.794) (28.531.554)<strong>Financial</strong> information for TGS as of 31 December 2012 and 31 December 2011 are as follows:31 December 2012 31 December 2011Total assets 191.883.128 191.800.346Total liabilities 62.788.835 46.455.002Shareholders’equity 129.094.293 145.345.344Group’s share in associate’sshareholders’ equity 64.547.147 72.672.67235