Financial - Turkish Airlines
Financial - Turkish Airlines
Financial - Turkish Airlines
- No tags were found...

Create successful ePaper yourself
Turn your PDF publications into a flip-book with our unique Google optimized e-Paper software.
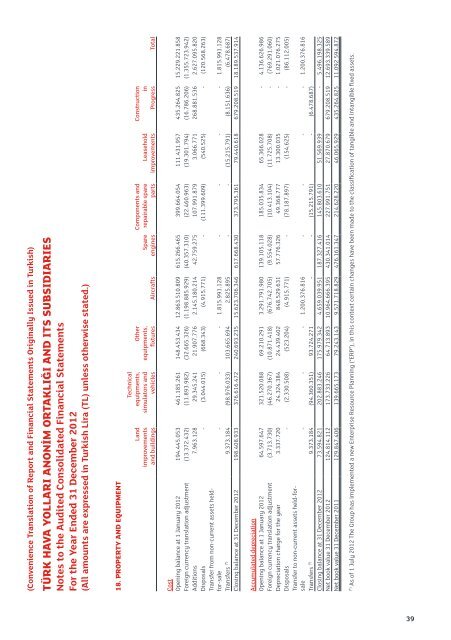
(Convenience Translation of Report and <strong>Financial</strong> Statements Originally Issued in <strong>Turkish</strong>)TÜRK HAVA YOLLARI ANONİM ORTAKLIĞI AND ITS SUBSIDIARIESNotes to the Audited Consolidated <strong>Financial</strong> StatementsFor the Year Ended 31 December 2012(All amounts are expressed in <strong>Turkish</strong> Lira (TL) unless otherwise stated.)18. PROPERTY AND EQUIPMENTLandimprovementsand buildingsTechnicalequipments,simulators andvehiclesOtherequipments,fixtures AircraftsSpareenginesComponents andrepairable sparepartsLeaseholdimprovementsConstructioninProgress TotalCostOpening balance at 1 January 2012 194.445.053 461.185.261 148.453.434 12.863.510.809 615.266.465 399.664.054 111.431.957 435.264.825 15.229.221.858Foreign currency translation adjustment (13.372.432) (11.893.982) (32.665.326) (1.198.885.929) (40.357.310) (22.460.963) (19.301.794) (16.786.206) (1.355.723.942)Additions 7.963.128 29.345.241 21.907.776 2.145.180.214 42.759.275 107.991.879 3.066.771 268.881.536 2.627.095.820Disposals - (3.044.015) (668.343) (4.915.771) - (111.399.609) (540.525) - (120.568.263)Transfer from non-current assets heldfor-sale- - - 1.815.991.128 - - - - 1.815.991.128Transfers (*) 9.373.184 (98.976.033) 103.665.694 2.825.895 - - (15.215.791) (8.151.636) (6.478.687)Closing balance at 31 December 2012 198.408.933 376.616.472 240.693.235 15.623.706.346 617.668.430 373.795.361 79.440.618 679.208.519 18.189.537.914Accumulated depreciationOpening balance at 1 January 2012 64.597.647 321.520.088 69.210.291 3.291.791.980 139.105.118 185.035.834 65.366.028 - 4.136.626.986Foreign currency translation adjustment (3.713.730) (46.270.367) (10.871.418) (676.742.705) (9.554.028) (10.413.104) (11.725.708) - (769.291.060)Depreciation charge for the year 3.337.720 24.324.384 24.439.402 848.529.631 57.776.326 49.368.777 13.300.035 - 1.021.076.275Disposals - (2.330.508) (523.204) (4.915.771) - (78.187.897) (154.625) - (86.112.005)Transfer to non-current assets held-forsale- - - 1.200.376.816 - - - - 1.200.376.816Transfers (*) 9.373.184 (94.360.351) 93.724.271 - - (15.215.791) - (6.478.687)Closing balance at 31 December 2012 73.594.821 202.883.246 175.979.342 4.659.039.951 187.327.416 145.803.610 51.569.939 - 5.496.198.325Net book value 31 December 2012 124.814.112 173.733.226 64.713.893 10.964.666.395 430.341.014 227.991.751 27.870.679 679.208.519 12.693.339.589Net book value 31 December 2011 129.847.406 139.665.173 79.243.143 9.571.718.829 476.161.347 214.628.220 46.065.929 435.264.825 11.092 594.872(*)As of 1 July 2012 The Group has implemented a new Enterprise Resource Planning (“ERP”), in this context certain changes have been made to the classification of tangible and intangible fixed assets.39