

2012-13 Government Mid-year Financial Projections Statement
2012-13 Government Mid-year Financial Projections Statement
2012-13 Government Mid-year Financial Projections Statement
- No tags were found...

You also want an ePaper? Increase the reach of your titles
YUMPU automatically turns print PDFs into web optimized ePapers that Google loves.
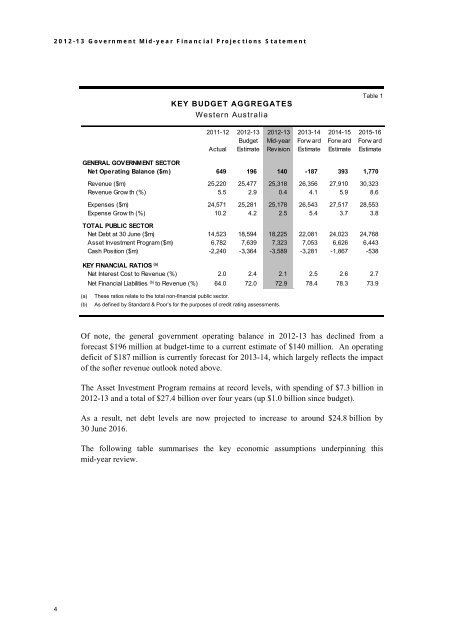
<strong>2012</strong>-<strong>13</strong> <strong>Government</strong> <strong>Mid</strong>-<strong>year</strong> <strong>Financial</strong> <strong>Projections</strong> <strong>Statement</strong>KEY BUDGET AGGREGATESWestern AustraliaTable 12011-12 <strong>2012</strong>-<strong>13</strong> <strong>2012</strong>-<strong>13</strong> 20<strong>13</strong>-14 2014-15 2015-16Budget <strong>Mid</strong>-<strong>year</strong> Forw ard Forw ard Forw ardActual Estimate Revision Estimate Estimate EstimateGENERAL GOVERNMENT SECTORNet Operating Balance ($m) 649 196 140 -187 393 1,770Revenue ($m) 25,220 25,477 25,318 26,356 27,910 30,323Revenue Grow th (%) 5.5 2.9 0.4 4.1 5.9 8.6Expenses ($m) 24,571 25,281 25,178 26,543 27,517 28,553Expense Grow th (%) 10.2 4.2 2.5 5.4 3.7 3.8TOTAL PUBLIC SECTORNet Debt at 30 June ($m) 14,523 18,594 18,225 22,081 24,023 24,768Asset Investment Program ($m) 6,782 7,639 7,323 7,053 6,626 6,443Cash Position ($m) -2,240 -3,364 -3,589 -3,281 -1,867 -538KEY FINANCIAL RATIOS (a)Net Interest Cost to Revenue (%) 2.0 2.4 2.1 2.5 2.6 2.7Net <strong>Financial</strong> Liabilities (b) to Revenue (%) 64.0 72.0 72.9 78.4 78.3 73.9(a)(b)These ratios relate to the total non-financial public sector.As defined by Standard & Poor’s for the purposes of credit rating assessments.Of note, the general government operating balance in <strong>2012</strong>-<strong>13</strong> has declined from aforecast $196 million at budget-time to a current estimate of $140 million. An operatingdeficit of $187 million is currently forecast for 20<strong>13</strong>-14, which largely reflects the impactof the softer revenue outlook noted above.The Asset Investment Program remains at record levels, with spending of $7.3 billion in<strong>2012</strong>-<strong>13</strong> and a total of $27.4 billion over four <strong>year</strong>s (up $1.0 billion since budget).As a result, net debt levels are now projected to increase to around $24.8 billion by30 June 2016.The following table summarises the key economic assumptions underpinning thismid-<strong>year</strong> review.4


