

2012-13 Government Mid-year Financial Projections Statement
2012-13 Government Mid-year Financial Projections Statement
2012-13 Government Mid-year Financial Projections Statement
- No tags were found...

You also want an ePaper? Increase the reach of your titles
YUMPU automatically turns print PDFs into web optimized ePapers that Google loves.
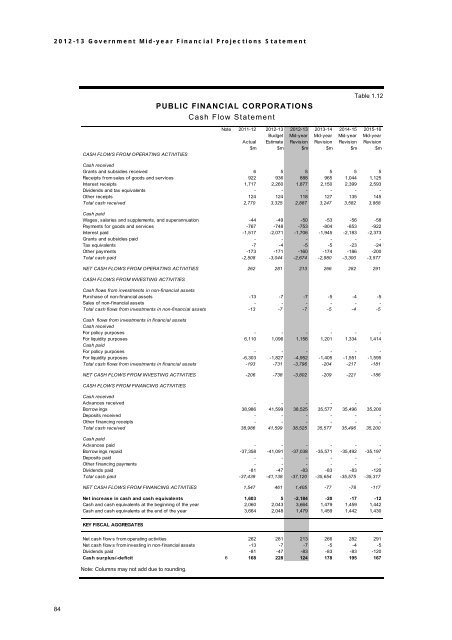
<strong>2012</strong>-<strong>13</strong> <strong>Government</strong> <strong>Mid</strong>-<strong>year</strong> <strong>Financial</strong> <strong>Projections</strong> <strong>Statement</strong>PUBLIC FINANCIAL CORPORATIONSCash Flow <strong>Statement</strong>Table 1.12CASH FLOWS FROM OPERATING ACTIVITIESNote 2011-12 <strong>2012</strong>-<strong>13</strong> <strong>2012</strong>-<strong>13</strong> 20<strong>13</strong>-14 2014-15 2015-16Budget <strong>Mid</strong>-<strong>year</strong> <strong>Mid</strong>-<strong>year</strong> <strong>Mid</strong>-<strong>year</strong> <strong>Mid</strong>-<strong>year</strong>Actual Estimate Revision Revision Revision Revision$m $m $m $m $m $mCash receivedGrants and subsidies received 6 5 5 5 5 5Receipts from sales of goods and services 922 936 888 965 1,044 1,125Interest receipts 1,717 2,260 1,877 2,150 2,399 2,593Dividends and tax equivalents - - - - - -Other receipts 124 124 118 127 <strong>13</strong>5 145Total cash received 2,770 3,325 2,887 3,247 3,582 3,868Cash paidWages, salaries and supplements, and superannuation -44 -49 -50 -53 -56 -58Payments for goods and services -767 -748 -753 -804 -853 -922Interest paid -1,517 -2,071 -1,706 -1,945 -2,183 -2,373Grants and subsidies paid - - - - - -Tax equivalents -7 -4 -5 -5 -23 -24Other payments -173 -171 -160 -174 -186 -200Total cash paid -2,508 -3,044 -2,674 -2,980 -3,300 -3,577NET CASH FLOWS FROM OPERATING ACTIVITIES 262 281 2<strong>13</strong> 266 282 291CASH FLOWS FROM INVESTING ACTIVITIESCash flows from investments in non-financial assetsPurchase of non-financial assets -<strong>13</strong> -7 -7 -5 -4 -5Sales of non-financial assets - - - - - -Total cash flows from investments in non-financial assets -<strong>13</strong> -7 -7 -5 -4 -5Cash flows from investments in financial assetsCash receivedFor policy purposes - - - - - -For liquidity purposes 6,110 1,096 1,156 1,201 1,334 1,414Cash paidFor policy purposes - - - - - -For liquidity purposes -6,303 -1,827 -4,952 -1,405 -1,551 -1,595Total cash flows from investments in financial assets -193 -731 -3,796 -204 -217 -181NET CASH FLOWS FROM INVESTING ACTIVITIES -206 -738 -3,802 -209 -221 -186CASH FLOWS FROM FINANCING ACTIVITIESCash receivedAdvances received - - - - - -Borrow ings 38,986 41,599 38,525 35,577 35,496 35,200Deposits received - - - - - -Other financing receipts - - - - - -Total cash received 38,986 41,599 38,525 35,577 35,496 35,200Cash paidAdvances paid - - - - - -Borrow ings repaid -37,358 -41,091 -37,038 -35,571 -35,492 -35,197Deposits paid - - - - - -Other financing payments - - - - - -Dividends paid -81 -47 -83 -83 -83 -120Total cash paid -37,439 -41,<strong>13</strong>8 -37,120 -35,654 -35,575 -35,317NET CASH FLOWS FROM FINANCING ACTIVITIES 1,547 461 1,405 -77 -78 -117Net increase in cash and cash equivalents 1,603 5 -2,184 -20 -17 -12Cash and cash equivalents at the beginning of the <strong>year</strong> 2,060 2,043 3,664 1,479 1,459 1,442Cash and cash equivalents at the end of the <strong>year</strong> 3,664 2,048 1,479 1,459 1,442 1,430KEY FISCAL AGGREGATESNet cash flow s from operating activities 262 281 2<strong>13</strong> 266 282 291Net cash flow s from investing in non-financial assets -<strong>13</strong> -7 -7 -5 -4 -5Dividends paid -81 -47 -83 -83 -83 -120Cash surplus/-deficit 6 168 228 124 178 195 167Note: Columns may not add due to rounding.84


