

2012-13 Government Mid-year Financial Projections Statement
2012-13 Government Mid-year Financial Projections Statement
2012-13 Government Mid-year Financial Projections Statement
- No tags were found...

You also want an ePaper? Increase the reach of your titles
YUMPU automatically turns print PDFs into web optimized ePapers that Google loves.
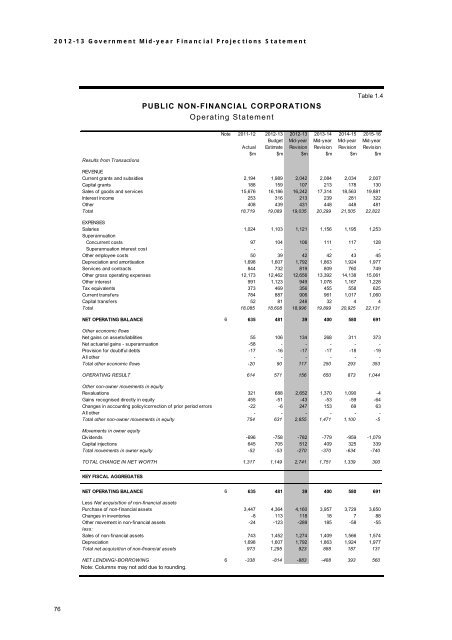
<strong>2012</strong>-<strong>13</strong> <strong>Government</strong> <strong>Mid</strong>-<strong>year</strong> <strong>Financial</strong> <strong>Projections</strong> <strong>Statement</strong>PUBLIC NON-FINANCIAL CORPORATIONSOperating <strong>Statement</strong>Table 1.4Results from TransactionsNote 2011-12 <strong>2012</strong>-<strong>13</strong> <strong>2012</strong>-<strong>13</strong> 20<strong>13</strong>-14 2014-15 2015-16Budget <strong>Mid</strong>-<strong>year</strong> <strong>Mid</strong>-<strong>year</strong> <strong>Mid</strong>-<strong>year</strong> <strong>Mid</strong>-<strong>year</strong>Actual Estimate Revision Revision Revision Revision$m $m $m $m $m $mREVENUECurrent grants and subsidies 2,194 1,989 2,042 2,084 2,034 2,007Capital grants 188 159 107 2<strong>13</strong> 178 <strong>13</strong>0Sales of goods and services 15,676 16,186 16,242 17,314 18,563 19,881Interest income 253 316 2<strong>13</strong> 239 281 322Other 408 439 431 448 448 481Total 18,719 19,089 19,035 20,299 21,505 22,822EXPENSESSalaries 1,024 1,103 1,121 1,156 1,195 1,253SuperannuationConcurrent costs 97 104 106 111 117 128Superannuation interest cost - - - - - -Other employee costs 50 39 42 42 43 45Depreciation and amortisation 1,698 1,607 1,792 1,863 1,924 1,977Services and contracts 844 732 819 809 760 749Other gross operating expenses 12,173 12,462 12,656 <strong>13</strong>,392 14,<strong>13</strong>8 15,061Other interest 991 1,123 949 1,078 1,167 1,228Tax equivalents 373 469 356 455 558 625Current transfers 784 887 906 961 1,017 1,060Capital transfers 52 81 248 32 4 4Total 18,085 18,608 18,996 19,899 20,925 22,<strong>13</strong>1NET OPERATING BALANCE 6 635 481 39 400 580 691Other economic flowsNet gains on assets/liabilities 55 106 <strong>13</strong>4 268 311 373Net actuarial gains - superannuation -58 - - - - -Provision for doubtful debts -17 -16 -17 -17 -18 -19All other - - - - - -Total other economic flows -20 90 117 250 293 353OPERATING RESULT 614 571 156 650 873 1,044Other non-owner movements in equityRevaluations 321 688 2,652 1,370 1,090 -4Gains recognised directly in equity 455 -51 -43 -53 -59 -64Changes in accounting policy/correction of prior period errors -22 -6 247 153 69 63All other - - - - - -Total other non-owner movements in equity 754 631 2,855 1,471 1,100 -5Movements in owner equityDividends -696 -758 -782 -779 -959 -1,079Capital injections 645 705 512 409 325 339Total movements in owner equity -52 -53 -270 -370 -634 -740TOTAL CHANGE IN NET WORTH 1,317 1,149 2,741 1,751 1,339 300KEY FISCAL AGGREGATESNET OPERATING BALANCE 6 635 481 39 400 580 691Less Net acquisition of non-financial assetsPurchase of non-financial assets 3,447 4,364 4,160 3,957 3,729 3,650Changes in inventories -8 1<strong>13</strong> 118 18 7 88Other movement in non-financial assets -24 -123 -289 185 -58 -55less:Sales of non-financial assets 743 1,452 1,274 1,409 1,566 1,574Depreciation 1,698 1,607 1,792 1,863 1,924 1,977Total net acquisition of non-financial assets 973 1,295 923 888 187 <strong>13</strong>1NET LENDING/-BORROWING 6 -338 -814 -883 -488 393 560Note: Columns may not add due to rounding.76


