2012-13 Government Mid-year Financial Projections Statement
2012-13 Government Mid-year Financial Projections Statement
2012-13 Government Mid-year Financial Projections Statement
- No tags were found...
Create successful ePaper yourself
Turn your PDF publications into a flip-book with our unique Google optimized e-Paper software.
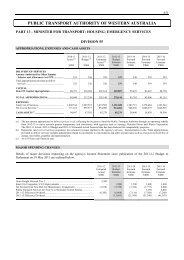
<strong>2012</strong>-<strong>13</strong> <strong>Government</strong> <strong>Mid</strong>-<strong>year</strong> <strong>Financial</strong> <strong>Projections</strong> <strong>Statement</strong>PUBLIC FINANCIAL CORPORATIONSOperating <strong>Statement</strong>Table 1.10Results from TransactionsNote 2011-12 <strong>2012</strong>-<strong>13</strong> <strong>2012</strong>-<strong>13</strong> 20<strong>13</strong>-14 2014-15 2015-16Budget <strong>Mid</strong>-<strong>year</strong> <strong>Mid</strong>-<strong>year</strong> <strong>Mid</strong>-<strong>year</strong> <strong>Mid</strong>-<strong>year</strong>Actual Estimate Revision Revision Revision Revision$m $m $m $m $m $mREVENUECurrent grants and subsidies - - - - - -Capital grants - - - - - -Sales of goods and services 957 956 923 986 1,021 1,096Interest income 1,768 2,260 1,876 2,150 2,399 2,593Other 5 - - - - -Total 2,730 3,216 2,799 3,<strong>13</strong>5 3,419 3,689EXPENSESSalaries 42 44 45 49 51 53SuperannuationConcurrent costs 4 4 4 5 5 5Superannuation interest cost - - - - - -Other employee costs 2 2 2 2 2 2Depreciation and amortisation 15 18 17 18 18 18Services and contracts <strong>13</strong> <strong>13</strong> <strong>13</strong> 15 16 17Other gross operating expenses 1,086 831 830 897 961 1,043Other interest 1,626 2,071 1,706 1,945 2,183 2,373Tax equivalents 8 35 26 26 24 21Current transfers 3 4 4 4 4 4Capital transfers - 4 7 4 4 4Total 2,798 3,026 2,654 2,964 3,268 3,542NET OPERATING BALANCE 6 -69 190 145 172 151 147Other economic flowsNet gains on assets/liabilities -58 - - - - -Net actuarial gains - superannuation -2 - - - - -Provision for doubtful debts - - - - - -All other - - - - - -Total other economic flows -60 - - - - -OPERATING RESULT -129 190 145 172 151 147Other non-owner movements in equityRevaluations 15 7 2 7 8 3Gains recognised directly in equity 97 - - - - -Changes in accounting policy/correction of prior period errors -94 2 69 3 - -All other - - - - - -Total other non-owner movements in equity 18 9 71 11 8 3Movements in owner equityDividends -52 -47 -83 -83 -83 -120Capital injections - - - - - -Total movements in owner equity -52 -47 -83 -83 -83 -120TOTAL CHANGE IN NET WORTH -164 152 <strong>13</strong>3 99 76 30KEY FISCAL AGGREGATESNET OPERATING BALANCE 6 -69 190 145 172 151 147Less Net acquisition of non-financial assetsPurchase of non-financial assets <strong>13</strong> 7 7 5 4 5Changes in inventories - - - - - -Other movement in non-financial assets - - - - - -less:Sales of non-financial assets - - - - - -Depreciation 15 18 17 18 18 18Total net acquisition of non-financial assets -2 -11 -11 -<strong>13</strong> -14 -14NET LENDING/-BORROWING 6 -67 201 156 184 165 161Note: Columns may not add due to rounding.82


