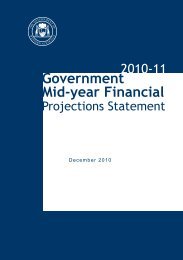
2012-13 Government Mid-year Financial Projections Statement
2012-13 Government Mid-year Financial Projections Statement
2012-13 Government Mid-year Financial Projections Statement
- No tags were found...
You also want an ePaper? Increase the reach of your titles
YUMPU automatically turns print PDFs into web optimized ePapers that Google loves.
Appendix 1TOTAL PUBLIC SECTORCash Flow <strong>Statement</strong>Table 1.15CASH FLOWS FROM OPERATING ACTIVITIESNote 2011-12 <strong>2012</strong>-<strong>13</strong> <strong>2012</strong>-<strong>13</strong> 20<strong>13</strong>-14 2014-15 2015-16Budget <strong>Mid</strong>-<strong>year</strong> <strong>Mid</strong>-<strong>year</strong> <strong>Mid</strong>-<strong>year</strong> <strong>Mid</strong>-<strong>year</strong>Actual Estimate Revision Revision Revision Revision$m $m $m $m $m $mCash receivedTaxes received 6,709 7,289 7,745 8,360 9,084 9,920Grants and subsidies received 9,831 8,993 8,823 8,225 8,187 8,904Receipts from sales of goods and services 18,061 18,392 18,426 19,615 20,995 22,469Interest receipts 920 1,065 954 934 1,026 1,046Dividends and tax equivalents - - - - - -Other 7,093 7,039 6,880 7,411 8,043 8,793Total cash received 42,6<strong>13</strong> 42,777 42,828 44,545 47,335 51,<strong>13</strong>3Cash paidWages, salaries and supplements, and superannuation -11,845 -12,544 -12,553 -<strong>13</strong>,144 -<strong>13</strong>,880 -14,946Payments for goods and services -18,351 -18,548 -18,773 -19,543 -20,326 -21,259Interest paid -1,485 -1,740 -1,529 -1,727 -1,914 -2,082Grants and subsidies paid -3,568 -3,777 -3,702 -4,009 -4,075 -4,219Dividends and tax equivalents - - - - - -Other payments -3,715 -3,531 -4,038 -3,952 -4,094 -4,514Total cash paid -38,963 -40,141 -40,595 -42,375 -44,289 -47,020NET CASH FLOWS FROM OPERATING ACTIVITIES 3,650 2,635 2,233 2,170 3,046 4,112CASH FLOWS FROM INVESTING ACTIVITIESCash flows from investments in non-financial assetsPurchase of non-financial assets -6,782 -7,639 -7,323 -7,053 -6,626 -6,443Sales of non-financial assets 892 1,640 1,501 1,602 1,7<strong>13</strong> 1,793Total cash flows from investments in non-financial assets -5,890 -5,999 -5,822 -5,451 -4,9<strong>13</strong> -4,650Cash flows from investments in financial assetsCash receivedFor policy purposes 6 - - - - -For liquidity purposes 6,288 1,101 1,242 1,218 1,347 1,451Cash paidFor policy purposes -6 - - - - -For liquidity purposes -6,518 -1,831 -5,077 -1,410 -1,557 -1,830Total cash flows from investments in financial assets -230 -730 -3,835 -192 -210 -379NET CASH FLOWS FROM INVESTING ACTIVITIES -6,120 -6,729 -9,657 -5,643 -5,123 -5,029CASH FLOWS FROM FINANCING ACTIVITIESCash receivedAdvances received - - - - - -Borrow ings 27,171 25,175 30,571 31,843 33,989 35,<strong>13</strong>4Deposits received - - - - - -Other financing receipts 52 84 82 306 90 42Total cash received 27,224 25,259 30,653 32,149 34,079 35,176Cash paidAdvances paid -14 -14 -15 -15 -15 -16Borrow ings repaid -21,252 -21,390 -25,767 -29,454 -31,293 -33,059Deposits paid - - - - - -Other financing payments -108 -111 -65 -79 -123 -128Total cash paid -21,374 -21,515 -25,847 -29,549 -31,431 -33,203NET CASH FLOWS FROM FINANCING ACTIVITIES 5,849 3,744 4,806 2,600 2,649 1,973Net increase in cash and cash equivalents 3,379 -350 -2,618 -874 572 1,056Cash and cash equivalents at the beginning of the <strong>year</strong> 8,602 8,095 11,981 9,362 8,489 9,060Cash and cash equivalents at the end of the <strong>year</strong> 11,981 7,745 9,362 8,489 9,060 10,117KEY FISCAL AGGREGATESNet cash flow s from operating activities 3,650 2,635 2,233 2,170 3,046 4,112Net cash flow s from investing in non-financial assets -5,890 -5,999 -5,822 -5,451 -4,9<strong>13</strong> -4,650Cash surplus/-deficit 6 -2,240 -3,364 -3,589 -3,281 -1,867 -538Note: Columns may not add due to rounding.87


