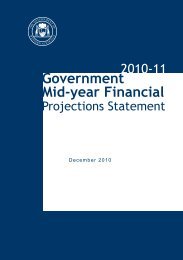
2012-13 Government Mid-year Financial Projections Statement
2012-13 Government Mid-year Financial Projections Statement
2012-13 Government Mid-year Financial Projections Statement
- No tags were found...
You also want an ePaper? Increase the reach of your titles
YUMPU automatically turns print PDFs into web optimized ePapers that Google loves.
Appendix 1GENERAL GOVERNMENTCash Flow <strong>Statement</strong>Table 1.3CASH FLOWS FROM OPERATING ACTIVITESNote 2011-12 <strong>2012</strong>-<strong>13</strong> <strong>2012</strong>-<strong>13</strong> 20<strong>13</strong>-14 2014-15 2015-16Budget <strong>Mid</strong>-<strong>year</strong> <strong>Mid</strong>-<strong>year</strong> <strong>Mid</strong>-<strong>year</strong> <strong>Mid</strong>-<strong>year</strong>Actual Estimate Revision Revision Revision Revision$m $m $m $m $m $mCash receivedTaxes received 7,091 7,749 8,204 8,842 9,585 10,440Grants and subsidies received 9,831 8,993 8,823 8,225 8,187 8,904Receipts from sales of goods and services 1,983 1,971 2,059 2,183 2,305 2,409Interest receipts 299 262 274 228 262 271Dividends and tax equivalents 1,127 1,164 1,170 1,216 1,560 1,744Other receipts 6,101 5,997 5,764 6,278 6,912 7,446Total cash received 26,433 26,<strong>13</strong>5 26,294 26,972 28,812 31,214Cash PaidWages, salaries and supplements, and superannuation -10,635 -11,255 -11,219 -11,764 -12,452 -<strong>13</strong>,439Payments for goods and services -6,815 -6,858 -7,167 -7,219 -7,310 -7,586Interest paid -353 -414 -364 -444 -542 -675Grants and subsidies paid -5,289 -5,289 -5,201 -5,620 -5,554 -5,584Dividends and tax equivalents - - - - - -Other payments -1,388 -1,312 -1,318 -1,220 -1,342 -1,342Total cash paid -24,480 -25,128 -25,268 -26,268 -27,200 -28,626NET CASH FLOWS FROM OPERATING ACTIVITIES 1,953 1,007 1,026 704 1,612 2,588CASH FLOWS FROM INVESTING ACTIVITESCash flows from investments in non-financial assetsPurchase of non-financial assets -3,358 -3,301 -3,191 -3,140 -2,925 -2,796Sales of non-financial assets 184 220 262 243 179 226Total cash flows from investments in non-financial assets -3,174 -3,080 -2,929 -2,898 -2,746 -2,570Cash flows from investments in financial assetsCash receivedFor policy purposes 6 - - - - -For liquidity purposes 1 - - - - -Cash paidFor policy purposes -669 -751 -759 -477 -325 -339For liquidity purposes -6 - -15 - - -Total cash flows from investments in financial assets -668 -752 -773 -477 -326 -340NET CASH FLOWS FROM INVESTING ACTIVITIES -3,842 -3,832 -3,703 -3,375 -3,072 -2,910CASH FLOWS FROM FINANCING ACTIVITIESCash receivedAdvances received 14 14 15 15 15 16Borrow ings 3,416 2,523 2,376 2,060 2,067 1,593Deposits received - - - - - -Other financing receipts 32 34 40 38 91 38Total cash receipts from financing activities 3,463 2,571 2,431 2,1<strong>13</strong> 2,173 1,647Cash paidAdvances paid -14 -14 -15 -15 -15 -16Borrow ings repaid -95 -127 -129 -171 -140 -<strong>13</strong>9Deposits paid - - - - - -Other financing payments -86 -72 -73 -112 -<strong>13</strong>0 -144Total payments for financing activities -196 -214 -216 -299 -285 -299NET CASH FLOWS FROM FINANCING ACTIVITIES 3,267 2,357 2,215 1,815 1,887 1,348Net increase in cash and cash equivalents 1,378 -469 -462 -856 427 1,026Cash and cash equivalents at the beginning of the <strong>year</strong> 5,418 5,094 6,796 6,334 5,479 5,906Cash and cash equivalents at the end of the <strong>year</strong> 6,796 4,625 6,334 5,479 5,906 6,932KEY FISCAL AGGREGATESNet cash flow s from operating activities 1,953 1,007 1,026 704 1,612 2,588Net cash flow s from investing in non-financial assets -3,174 -3,080 -2,929 -2,898 -2,746 -2,570Cash surplus/-deficit 6 -1,221 -2,074 -1,904 -2,194 -1,<strong>13</strong>4 17Note: Columns may not add due to rounding.75


