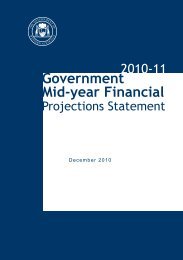
2012-13 Government Mid-year Financial Projections Statement
2012-13 Government Mid-year Financial Projections Statement
2012-13 Government Mid-year Financial Projections Statement
- No tags were found...
You also want an ePaper? Increase the reach of your titles
YUMPU automatically turns print PDFs into web optimized ePapers that Google loves.
<strong>2012</strong>-<strong>13</strong> <strong>Government</strong> <strong>Mid</strong>-<strong>year</strong> <strong>Financial</strong> <strong>Projections</strong> <strong>Statement</strong>PUBLIC NON-FINANCIAL CORPORATIONSCash Flow <strong>Statement</strong>Table 1.6CASH FLOWS FROM OPERATING ACTIVITIESNote 2011-12 <strong>2012</strong>-<strong>13</strong> <strong>2012</strong>-<strong>13</strong> 20<strong>13</strong>-14 2014-15 2015-16Budget <strong>Mid</strong>-<strong>year</strong> <strong>Mid</strong>-<strong>year</strong> <strong>Mid</strong>-<strong>year</strong> <strong>Mid</strong>-<strong>year</strong>Actual Estimate Revision Revision Revision Revision$m $m $m $m $m $mCash receivedGrants and subsidies received 2,214 2,151 2,153 2,308 2,217 2,142Receipts from sales of goods and services 15,829 16,183 16,211 17,230 18,451 19,769Interest receipts 253 316 214 239 281 322Dividends and tax equivalents 73 41 45 45 47 87Other receipts 1,262 948 1,031 1,033 1,024 1,230Total cash received 19,632 19,638 19,653 20,855 22,020 23,550Cash paidWages, salaries and supplements, and superannuation -1,166 -1,241 -1,285 -1,327 -1,373 -1,449Payments for goods and services -11,804 -11,640 -11,591 -12,284 -12,967 -<strong>13</strong>,586Interest paid -964 -1,027 -869 -1,020 -1,105 -1,175Grants and subsidies paid -523 -664 -679 -722 -763 -802Tax equivalents -418 -397 -346 -393 -543 -605Other payments -2,546 -2,519 -3,026 -3,046 -3,075 -3,498Total cash paid -17,421 -17,487 -17,795 -18,793 -19,826 -21,115NET CASH FLOWS FROM OPERATING ACTIVITIES 2,211 2,151 1,858 2,062 2,194 2,436CASH FLOWS FROM INVESTING ACTIVITIESCash flows from investments in non-financial assetsPurchase of non-financial assets -3,447 -4,364 -4,160 -3,957 -3,729 -3,650Sales of non-financial assets 743 1,452 1,274 1,409 1,566 1,574Total cash flows from investments in non-financial assets -2,703 -2,912 -2,886 -2,548 -2,163 -2,075Cash flows from investments in financial assetsCash receivedFor policy purposes - - - - - -For liquidity purposes 177 5 86 17 14 37Cash paidFor policy purposes - - -5 - - -For liquidity purposes -210 -4 -110 -6 -6 -235Total cash flows from investments in financial assets -32 1 -30 12 8 -197NET CASH FLOWS FROM INVESTING ACTIVITIES -2,736 -2,911 -2,915 -2,536 -2,155 -2,273CASH FLOWS FROM FINANCING ACTIVITIESCash receivedAdvances received - - - - - -Borrow ings 12,748 16,071 8,0<strong>13</strong> 2,725 2,777 2,048Deposits received - - - - - -Other financing receipts 723 827 830 803 364 394Total cash received <strong>13</strong>,472 16,898 8,843 3,528 3,141 2,442Cash paidAdvances paid -14 -14 -15 -15 -15 -16Borrow ings repaid -11,778 -15,189 -6,944 -2,232 -2,011 -1,430Deposits paid - - - - - -Other financing payments -62 -64 -18 -26 -32 -34Dividends paid -695 -757 -782 -779 -959 -1,083Total cash paid -12,549 -16,024 -7,758 -3,052 -3,018 -2,563NET CASH FLOWS FROM FINANCING ACTIVITIES 923 874 1,085 476 123 -121Net increase in cash and cash equivalents 398 114 28 2 162 43Cash and cash equivalents at the beginning of the <strong>year</strong> 1,125 958 1,522 1,550 1,552 1,714Cash and cash equivalents at the end of the <strong>year</strong> 1,522 1,072 1,550 1,552 1,714 1,756KEY FISCAL AGGREGATESNet cash flow s from operating activities 2,211 2,151 1,858 2,062 2,194 2,436Net cash flow s from investing in non-financial assets -2,703 -2,912 -2,886 -2,548 -2,163 -2,075Dividends paid -695 -757 -782 -779 -959 -1,083Cash surplus/-deficit 6 -1,188 -1,518 -1,809 -1,265 -928 -722Note: Columns may not add due to rounding.78


