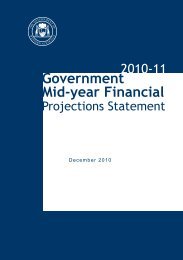
2012-13 Government Mid-year Financial Projections Statement
2012-13 Government Mid-year Financial Projections Statement
2012-13 Government Mid-year Financial Projections Statement
- No tags were found...
Create successful ePaper yourself
Turn your PDF publications into a flip-book with our unique Google optimized e-Paper software.
<strong>2012</strong>-<strong>13</strong> <strong>Government</strong> <strong>Mid</strong>-<strong>year</strong> <strong>Financial</strong> <strong>Projections</strong> <strong>Statement</strong>TOTAL NON-FINANCIAL PUBLIC SECTORBalance Sheet at 30 JuneTable 1.8Note <strong>2012</strong> 20<strong>13</strong> 20<strong>13</strong> 2014 2015 2016Budget <strong>Mid</strong>-<strong>year</strong> <strong>Mid</strong>-<strong>year</strong> <strong>Mid</strong>-<strong>year</strong> <strong>Mid</strong>-<strong>year</strong>Actual Estimate Revision Revision Revision Revision$m $m $m $m $m $mASSETS<strong>Financial</strong> assetsCash and deposits 1,591 1,359 1,472 1,487 1,616 1,635Advances paid 222 226 223 220 217 217Investments, loans and placements 10,209 9,479 11,381 10,493 10,937 12,177Receivables 3,670 3,522 3,540 3,783 3,970 4,143Investment property 35 30 35 35 35 35Shares and other equityInvestments in other public sector entities - equity method 1,286 1,656 1,420 1,518 1,594 1,625Investments in other public sector entities - direct injections - - - - - -Investments in other entities 28 28 17 10 10 10Other financial assets - - - - - -Total financial assets 17,041 16,300 18,087 17,546 18,379 19,841Non-financial assetsLand 51,751 55,206 54,369 56,154 57,760 58,186Property, plant and equipment 83,676 87,897 88,530 93,368 97,170 100,797Biological assets 335 343 331 328 322 316InventoriesLand inventories 1,831 2,031 2,106 2,2<strong>13</strong> 2,265 2,146Other inventories 3,443 3,911 3,559 3,577 3,584 3,672Intangibles 929 640 837 773 766 730Non-current assets held for sale 110 61 105 74 72 72Other 385 290 251 236 236 250Total non-financial assets 142,461 150,380 150,090 156,724 162,175 166,170TOTAL ASSETS 159,502 166,680 168,176 174,270 180,555 186,011LIABILITIESDeposits held 193 67 191 191 191 191Advances received 454 440 439 424 408 393Borrow ings 27,479 30,862 32,265 35,350 37,974 39,967Unfunded superannuation 9,086 8,503 9,222 9,067 8,965 8,947Other employee benefits 3,193 3,117 3,224 3,263 3,304 3,048Payables 5,050 4,965 5,095 5,120 5,163 5,197Other liabilities 2,571 2,181 2,694 2,644 2,684 2,691TOTAL LIABILITIES 48,026 50,<strong>13</strong>6 53,<strong>13</strong>0 56,059 58,690 60,434NET ASSETS 111,475 116,544 115,046 118,211 121,865 125,578Of which:Contributed equity - - - - - -Accumulated surplus 28,575 29,364 28,739 28,296 28,493 30,068Other reserves 82,900 87,180 86,307 89,915 93,372 95,509NET WORTH 6 111,475 116,544 115,046 118,211 121,865 125,578MEMORANDUM ITEMSNet financial worth -30,985 -33,836 -35,043 -38,5<strong>13</strong> -40,310 -40,593Net financial liabilities 32,300 35,520 36,480 40,041 41,915 42,228Net debtGross debt liabilities 28,126 31,370 32,895 35,965 38,573 40,551less : liquid financial assets 12,022 11,063 <strong>13</strong>,075 12,200 12,770 14,028less: convergence differences impacting net debt 88 88 88 88 88 -Net debt 16,016 20,218 19,732 23,678 25,715 26,522Note: Columns may not add due to rounding.80


