Trust Board papers - University Hospital Southampton NHS ...
Trust Board papers - University Hospital Southampton NHS ...
Trust Board papers - University Hospital Southampton NHS ...

Create successful ePaper yourself
Turn your PDF publications into a flip-book with our unique Google optimized e-Paper software.
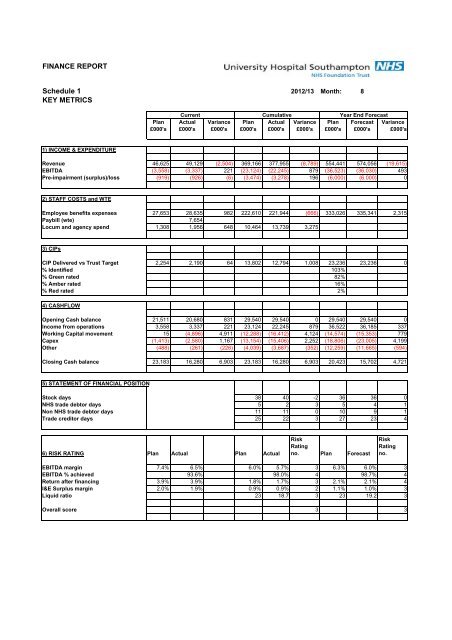
FINANCE REPORTSchedule 1 2012/13 Month: 8KEY METRICSCurrent Cumulative Year End ForecastPlan Actual Variance Plan Actual Variance Plan Forecast Variance£000's £000's £000's £000's £000's £000's £000's £000's £000's1) INCOME & EXPENDITURERevenue 46,625 49,129 (2,504) 369,166 377,955 (8,789) 554,441 574,056 (19,615)EBITDA (3,558) (3,337) 221 (23,124) (22,245) 879 (36,523) (36,030) 493Pre-impairment (surplus)/loss (919) (926) (6) (3,474) (3,278) 196 (6,000) (6,000) 02) STAFF COSTS and WTEEmployee benefits expenses 27,653 28,635 982 222,610 221,944 (666) 333,026 335,341 2,315Paybill (wte) 7,654Locum and agency spend 1,308 1,956 648 10,464 13,739 3,2753) CIPsCIP Delivered vs <strong>Trust</strong> Target 2,254 2,190 64 13,802 12,794 1,008 23,236 23,236 0% Identified 103%% Green rated 82%% Amber rated 16%% Red rated 2%4) CASHFLOWOpening Cash balance 21,511 20,680 831 29,540 29,540 0 29,540 29,540 0Income from operations 3,558 3,337 221 23,124 22,245 879 36,522 36,185 337Working Capital movement 15 (4,896) 4,911 (12,288) (16,412) 4,124 (14,574) (15,353) 779Capex (1,413) (2,580) 1,167 (13,154) (15,406) 2,252 (18,806) (23,005) 4,199Other (488) (261) (226) (4,039) (3,687) (352) (12,259) (11,665) (594)Closing Cash balance 23,183 16,280 6,903 23,183 16,280 6,903 20,423 15,702 4,7215) STATEMENT OF FINANCIAL POSITIONStock days 38 40 -2 36 36 0<strong>NHS</strong> trade debtor days 5 2 3 5 4 1Non <strong>NHS</strong> trade debtor days 11 11 0 10 9 1Trade creditor days 25 22 3 27 23 46) RISK RATING Plan Actual Plan ActualRiskRatingno. Plan ForecastRiskRatingno.EBITDA margin 7.4% 6.5% 6.0% 5.7% 3 6.3% 6.0% 3EBITDA % achieved 93.6% 98.0% 4 98.7% 4Return after financing 3.9% 3.9% 1.8% 1.7% 3 2.1% 2.1% 4I&E Surplus margin 2.0% 1.9% 0.9% 0.9% 2 1.1% 1.0% 3Liquid ratio 23 18.7 3 23 19.2 3Overall score 3 3