Trust Board papers - University Hospital Southampton NHS ...
Trust Board papers - University Hospital Southampton NHS ...
Trust Board papers - University Hospital Southampton NHS ...

Create successful ePaper yourself
Turn your PDF publications into a flip-book with our unique Google optimized e-Paper software.
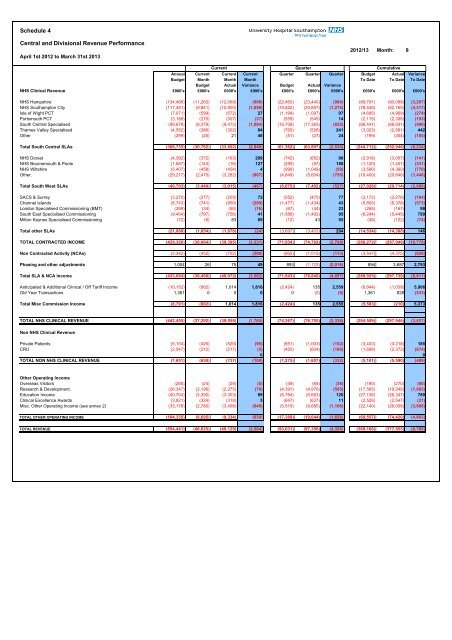
Schedule 4Central and Divisional Revenue PerformanceApril 1st 2012 to March 31st 20132012/13 Month: 8Current Quarter CumulativeAnnual Current Current Current Quarter Quarter Quarter Budget Actual VarianceBudget Month Month Month To Date To Date To DateBudget Actual Variance Budget Actual Variance<strong>NHS</strong> Clinical Revenue £000's £000's £000's £000's £000's £000's £000's £000's £000's £000's<strong>NHS</strong> Hampshire (134,468) (11,263) (12,069) (806) (22,460) (23,440) (980) (89,791) (93,088) (3,297)<strong>NHS</strong> <strong>Southampton</strong> City (117,481) (9,841) (10,900) (1,059) (19,622) (20,897) (1,275) (78,448) (82,765) (4,317)Isle of Wight PCT (7,071) (599) (572) 27 (1,194) (1,097) 97 (4,695) (4,969) (274)Portsmouth PCT (3,186) (270) (307) (37) (559) (545) 14 (2,115) (2,308) (193)South Central Specialised (99,678) (8,379) (9,473) (1,094) (16,708) (17,363) (655) (66,441) (66,931) (490)Thames Valley Specialised (4,552) (386) (302) 84 (769) (528) 241 (3,023) (2,581) 442Other (299) (25) 21 46 (51) (27) 24 (199) (304) (105)Total South Central SLAs (366,735) (30,762) (33,602) (2,840) (61,362) (63,897) (2,535) (244,712) (252,946) (8,234)<strong>NHS</strong> Dorset (4,392) (372) (163) 209 (742) (652) 90 (2,916) (3,057) (141)<strong>NHS</strong> Bournemouth & Poole (1,687) (143) (16) 127 (285) (97) 188 (1,120) (1,451) (331)<strong>NHS</strong> Wiltshire (5,407) (458) (454) 4 (999) (1,049) (50) (3,590) (4,360) (770)Other. (29,217) (2,475) (3,282) (807) (4,849) (5,604) (755) (19,400) (20,846) (1,446)Total South West SLAs (40,703) (3,448) (3,915) (467) (6,875) (7,402) (527) (27,026) (29,714) (2,688)SACS & Surrey (3,270) (277) (205) 72 (552) (475) 77 (2,172) (2,276) (104)Channel Islands (8,743) (741) (950) (209) (1,477) (1,434) 43 (5,805) (6,378) (573)London Specialised Commissioning (BMT) (399) (34) (50) (16) (67) (44) 23 (265) (167) 98South East Specialised Commissioning (9,404) (797) (756) 41 (1,588) (1,493) 95 (6,244) (5,445) 799Milton Keynes Specialised Commissioning (72) (6) 83 89 (12) 43 55 (48) (122) (74)Total other SLAs (21,888) (1,854) (1,878) (24) (3,697) (3,403) 294 (14,534) (14,388) 146TOTAL CONTRACTED INCOME (429,326) (36,064) (39,395) (3,331) (71,934) (74,702) (2,768) (286,272) (297,048) (10,776)Non Contracted Activity (NCAs) (5,342) (452) (752) (300) (902) (1,015) (113) (3,547) (4,375) (828)Phasing and other adjustments 1,004 26 75 49 893 (1,123) (2,016) 894 3,687 2,793Total SLA & NCA Income (433,664) (36,490) (40,072) (3,582) (71,943) (76,840) (4,897) (288,925) (297,736) (8,811)Anticipated & Additional Clinical / Off Tariff Income (10,152) (802) 1,014 1,816 (2,424) 135 2,559 (6,944) (1,038) 5,906Old Year Transactions 1,361 0 0 0 0 (0) (0) 1,361 828 (533)Total Misc Commission Income (8,791) (802) 1,014 1,816 (2,424) 135 2,559 (5,583) (210) 5,373TOTAL <strong>NHS</strong> CLINICAL REVENUE (442,455) (37,292) (39,058) (1,765) (74,367) (76,705) (2,338) (294,509) (297,946) (3,437)Non <strong>NHS</strong> Clinical RevenuePrivate Patients (5,104) (425) (520) (95) (851) (1,003) (152) (3,403) (3,218) 185CRU (2,547) (212) (217) (5) (425) (604) (180) (1,698) (2,372) (674)0 0TOTAL NON <strong>NHS</strong> CLINICAL REVENUE (7,651) (638) (737) (100) (1,275) (1,607) (332) (5,101) (5,590) (489)Other Operating IncomeOverseas Visitors (285) (24) (29) (5) (48) (84) (36) (190) (270) (80)Research & Development. (26,347) (2,196) (2,275) (79) (4,391) (4,976) (585) (17,565) (19,248) (1,683)Education Income (40,704) (3,392) (3,303) 89 (6,784) (6,663) 120 (27,136) (26,347) 789Clinical Excellence Awards (3,821) (324) (318) 5 (647) (637) 11 (2,526) (2,547) (21)Misc. Other Operating Income (see annex 2) (33,178) (2,760) (3,408) (649) (5,519) (6,685) (1,166) (22,140) (26,008) (3,868)TOTAL OTHER OPERATING INCOME (104,335) (8,695) (9,334) (639) (17,389) (19,044) (1,656) (69,557) (74,420) (4,863)TOTAL REVENUE (554,441) (46,625) (49,129) (2,504) (93,031) (97,356) (4,326) (369,166) (377,955) (8,789)