Dell Power Solutions
Dell Power Solutions
Dell Power Solutions
- No tags were found...

Create successful ePaper yourself
Turn your PDF publications into a flip-book with our unique Google optimized e-Paper software.
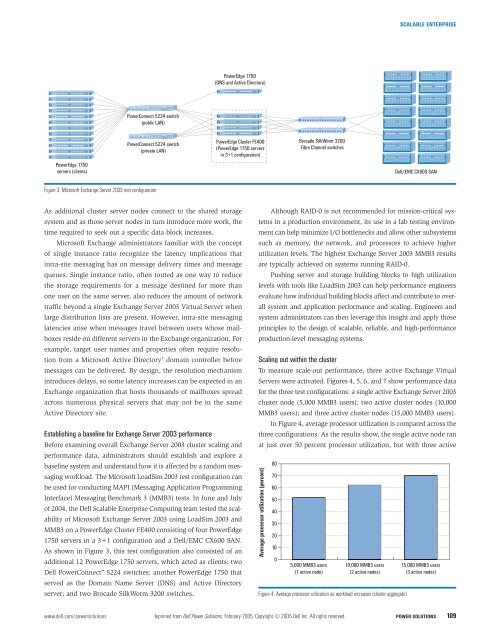
SCALABLE ENTERPRISE<strong>Power</strong>Edge 1750(DNS and Active Directory)<strong>Power</strong>Connect 5224 switch(public LAN)<strong>Power</strong>Edge 1750servers (clients)<strong>Power</strong>Connect 5224 switch(private LAN)<strong>Power</strong>Edge Cluster FE400(<strong>Power</strong>Edge 1750 serversin 3+1 configuration)Brocade SilkWorm 3200Fibre Channel switches<strong>Dell</strong>/EMC CX600 SANFigure 3. Microsoft Exchange Server 2003 test configurationAs additional cluster server nodes connect to the shared storagesystem and as those server nodes in turn introduce more work, thetime required to seek out a specific data block increases.Microsoft Exchange administrators familiar with the conceptof single instance ratio recognize the latency implications thatintra-site messaging has on message delivery times and messagequeues. Single instance ratio, often touted as one way to reducethe storage requirements for a message destined for more thanone user on the same server, also reduces the amount of networktraffic beyond a single Exchange Server 2003 Virtual Server whenlarge distribution lists are present. However, intra-site messaginglatencies arise when messages travel between users whose mailboxesreside on different servers in the Exchange organization. Forexample, target user names and properties often require resolutionfrom a Microsoft Active Directory ® domain controller beforemessages can be delivered. By design, the resolution mechanismintroduces delays, so some latency increases can be expected in anExchange organization that hosts thousands of mailboxes spreadacross numerous physical servers that may not be in the sameActive Directory site.Establishing a baseline for Exchange Server 2003 performanceBefore examining overall Exchange Server 2003 cluster scaling andperformance data, administrators should establish and explore abaseline system and understand how it is affected by a random messagingworkload. The Microsoft LoadSim 2003 test configuration canbe used for conducting MAPI (Messaging Application ProgrammingInterface) Messaging Benchmark 3 (MMB3) tests. In June and Julyof 2004, the <strong>Dell</strong> Scalable Enterprise Computing team tested the scalabilityof Microsoft Exchange Server 2003 using LoadSim 2003 andMMB3 on a <strong>Power</strong>Edge Cluster FE400 consisting of four <strong>Power</strong>Edge1750 servers in a 3+1 configuration and a <strong>Dell</strong>/EMC CX600 SAN.As shown in Figure 3, this test configuration also consisted of anadditional 12 <strong>Power</strong>Edge 1750 servers, which acted as clients; two<strong>Dell</strong> <strong>Power</strong>Connect 5224 switches; another <strong>Power</strong>Edge 1750 thatserved as the Domain Name Server (DNS) and Active Directoryserver; and two Brocade SilkWorm 3200 switches.Although RAID-0 is not recommended for mission-critical systemsin a production environment, its use in a lab testing environmentcan help minimize I/O bottlenecks and allow other subsystemssuch as memory, the network, and processors to achieve higherutilization levels. The highest Exchange Server 2003 MMB3 resultsare typically achieved on systems running RAID-0.Pushing server and storage building blocks to high utilizationlevels with tools like LoadSim 2003 can help performance engineersevaluate how individual building blocks affect and contribute to overallsystem and application performance and scaling. Engineers andsystem administrators can then leverage this insight and apply thoseprinciples to the design of scalable, reliable, and high-performanceproduction-level messaging systems.Scaling out within the clusterTo measure scale-out performance, three active Exchange VirtualServers were activated. Figures 4, 5, 6, and 7 show performance datafor the three test configurations: a single active Exchange Server 2003cluster node (5,000 MMB3 users); two active cluster nodes (10,000MMB3 users); and three active cluster nodes (15,000 MMB3 users).In Figure 4, average processor utilization is compared across thethree configurations. As the results show, the single active node ranat just over 50 percent processor utilization, but with three activeAverage processor utilization (percent)807060504030201005,000 MMB3 users(1 active node)10,000 MMB3 users(2 active nodes)Figure 4. Average processor utilization as workload increases (cluster aggregate)15,000 MMB3 users(3 active nodes)www.dell.com/powersolutions Reprinted from <strong>Dell</strong> <strong>Power</strong> <strong>Solutions</strong>, February 2005. Copyright © 2005 <strong>Dell</strong> Inc. All rights reserved. POWER SOLUTIONS 109