

Full report. - Social Research and Demonstration Corp
Full report. - Social Research and Demonstration Corp
Full report. - Social Research and Demonstration Corp

Create successful ePaper yourself
Turn your PDF publications into a flip-book with our unique Google optimized e-Paper software.
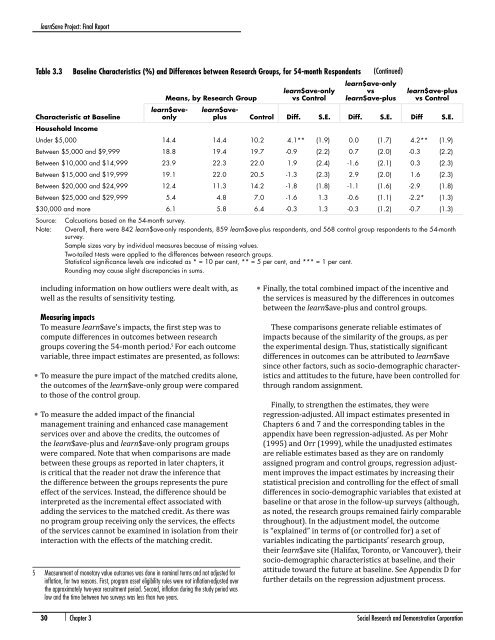
learn$ave Project: Final ReportTable 3.3Baseline Characteristics (%) <strong>and</strong> Differences between <strong>Research</strong> Groups, for 54-month RespondentsCharacteristic at BaselineMeans, by <strong>Research</strong> Grouplearn$ave-onlyvs Control(Continued)learn$ave-onlyvslearn$ave-pluslearn$ave-plusvs Controllearn$aveonlylearn$aveplusControl Diff. S.E. Diff. S.E. Diff S.E.Household IncomeUnder $5,000 14.4 14.4 10.2 4.1** (1.9) 0.0 (1.7) 4.2** (1.9)Between $5,000 <strong>and</strong> $9,999 18.8 19.4 19.7 -0.9 (2.2) 0.7 (2.0) -0.3 (2.2)Between $10,000 <strong>and</strong> $14,999 23.9 22.3 22.0 1.9 (2.4) -1.6 (2.1) 0.3 (2.3)Between $15,000 <strong>and</strong> $19,999 19.1 22.0 20.5 -1.3 (2.3) 2.9 (2.0) 1.6 (2.3)Between $20,000 <strong>and</strong> $24,999 12.4 11.3 14.2 -1.8 (1.8) -1.1 (1.6) -2.9 (1.8)Between $25,000 <strong>and</strong> $29,999 5.4 4.8 7.0 -1.6 1.3 -0.6 (1.1) -2.2* (1.3)$30,000 <strong>and</strong> more 6.1 5.8 6.4 -0.3 1.3 -0.3 (1.2) -0.7 (1.3)Source: Calcuations based on the 54-month survey.Note: Overall, there were 842 learn$ave-only respondents, 859 learn$ave-plus respondents, <strong>and</strong> 568 control group respondents to the 54-monthsurvey.Sample sizes vary by individual measures because of missing values.Two-tailed t-tests were applied to the differences between research groups.Statistical significance levels are indicated as * = 10 per cent, ** = 5 per cent, <strong>and</strong> *** = 1 per cent.Rounding may cause slight discrepancies in sums.including information on how outliers were dealt with, aswell as the results of sensitivity testing.Measuring impactsTo measure learn$ave’s impacts, the first step was tocompute differences in outcomes between researchgroups covering the 54-month period. 5 For each outcomevariable, three impact estimates are presented, as follows:• To measure the pure impact of the matched credits alone,the outcomes of the learn$ave-only group were comparedto those of the control group.• To measure the added impact of the financialmanagement training <strong>and</strong> enhanced case managementservices over <strong>and</strong> above the credits, the outcomes ofthe learn$ave-plus <strong>and</strong> learn$ave-only program groupswere compared. Note that when comparisons are madebetween these groups as <strong>report</strong>ed in later chapters, itis critical that the reader not draw the inference thatthe difference between the groups represents the pureeffect of the services. Instead, the difference should beinterpreted as the incremental effect associated withadding the services to the matched credit. As there wasno program group receiving only the services, the effectsof the services cannot be examined in isolation from theirinteraction with the effects of the matching credit.5 Measurement of monetary value outcomes was done in nominal terms <strong>and</strong> not adjusted forinflation, for two reasons. First, program asset eligibility rules were not inflation-adjusted overthe approximately two-year recruitment period. Second, inflation during the study period waslow <strong>and</strong> the time between two surveys was less than two years.• Finally, the total combined impact of the incentive <strong>and</strong>the services is measured by the differences in outcomesbetween the learn$ave-plus <strong>and</strong> control groups.These comparisons generate reliable estimates ofimpacts because of the similarity of the groups, as perthe experimental design. Thus, statistically significantdifferences in outcomes can be attributed to learn$avesince other factors, such as socio-demographic characteristics<strong>and</strong> attitudes to the future, have been controlled forthrough r<strong>and</strong>om assignment.Finally, to strengthen the estimates, they wereregression-adjusted. All impact estimates presented inChapters 6 <strong>and</strong> 7 <strong>and</strong> the corresponding tables in theappendix have been regression-adjusted. As per Mohr(1995) <strong>and</strong> Orr (1999), while the unadjusted estimatesare reliable estimates based as they are on r<strong>and</strong>omlyassigned program <strong>and</strong> control groups, regression adjustmentimproves the impact estimates by increasing theirstatistical precision <strong>and</strong> controlling for the effect of smalldifferences in socio-demographic variables that existed atbaseline or that arose in the follow-up surveys (although,as noted, the research groups remained fairly comparablethroughout). In the adjustment model, the outcomeis “explained” in terms of (or controlled for) a set ofvariables indicating the participants’ research group,their learn$ave site (Halifax, Toronto, or Vancouver), theirsocio-demographic characteristics at baseline, <strong>and</strong> theirattitude toward the future at baseline. See Appendix D forfurther details on the regression adjustment process.30 | Chapter 3 <strong>Social</strong> <strong>Research</strong> <strong>and</strong> <strong>Demonstration</strong> <strong>Corp</strong>oration

