

Full report. - Social Research and Demonstration Corp
Full report. - Social Research and Demonstration Corp
Full report. - Social Research and Demonstration Corp

Create successful ePaper yourself
Turn your PDF publications into a flip-book with our unique Google optimized e-Paper software.
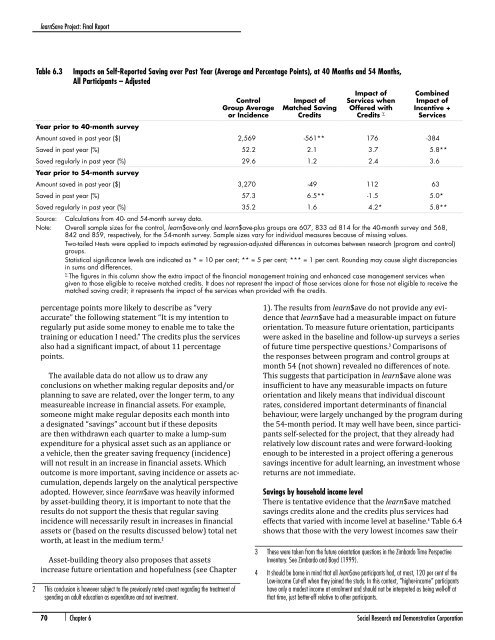
learn$ave Project: Final ReportTable 6.3Impacts on Self-Reported Saving over Past Year (Average <strong>and</strong> Percentage Points), at 40 Months <strong>and</strong> 54 Months,All Participants – AdjustedControlGroup Averageor IncidenceImpact ofMatched SavingCreditsImpact ofServices whenOffered withCredits ∑CombinedImpact ofIncentive +ServicesYear prior to 40-month surveyAmount saved in past year ($) 2,569 -561** 176 -384Saved in past year (%) 52.2 2.1 3.7 5.8**Saved regularly in past year (%) 29.6 1.2 2.4 3.6Year prior to 54-month surveyAmount saved in past year ($) 3,270 -49 112 63Saved in past year (%) 57.3 6.5** -1.5 5.0*Saved regularly in past year (%) 35.2 1.6 4.2* 5.8**Source: Calculations from 40- <strong>and</strong> 54-month survey data.Note: Overall sample sizes for the control, learn$ave-only <strong>and</strong> learn$ave-plus groups are 607, 833 ad 814 for the 40-month survey <strong>and</strong> 568,842 <strong>and</strong> 859, respectively, for the 54-month survey. Sample sizes vary for individual measures because of missing values.Two-tailed t-tests were applied to impacts estimated by regression-adjusted differences in outcomes between research (program <strong>and</strong> control)groups.Statistical significance levels are indicated as * = 10 per cent; ** = 5 per cent; *** = 1 per cent. Rounding may cause slight discrepanciesin sums <strong>and</strong> differences.∑The figures in this column show the extra impact of the financial management training <strong>and</strong> enhanced case management services whengiven to those eligible to receive matched credits. It does not represent the impact of those services alone for those not eligible to receive thematched saving credit; it represents the impact of the services when provided with the credits.percentage points more likely to describe as “veryaccurate” the following statement “It is my intention toregularly put aside some money to enable me to take thetraining or education I need.” The credits plus the servicesalso had a significant impact, of about 11 percentagepoints.The available data do not allow us to draw anyconclusions on whether making regular deposits <strong>and</strong>/orplanning to save are related, over the longer term, to anymeasureable increase in financial assets. For example,someone might make regular deposits each month intoa designated “savings” account but if these depositsare then withdrawn each quarter to make a lump-sumexpenditure for a physical asset such as an appliance ora vehicle, then the greater saving frequency (incidence)will not result in an increase in financial assets. Whichoutcome is more important, saving incidence or assets accumulation,depends largely on the analytical perspectiveadopted. However, since learn$ave was heavily informedby asset-building theory, it is important to note that theresults do not support the thesis that regular savingincidence will necessarily result in increases in financialassets or (based on the results discussed below) total networth, at least in the medium term. 2Asset-building theory also proposes that assetsincrease future orientation <strong>and</strong> hopefulness (see Chapter2 This conclusion is however subject to the previously noted caveat regarding the treatment ofspending on adult education as expenditure <strong>and</strong> not investment.1). The results from learn$ave do not provide any evidencethat learn$ave had a measurable impact on futureorientation. To measure future orientation, participantswere asked in the baseline <strong>and</strong> follow-up surveys a seriesof future time perspective questions. 3 Comparisons ofthe responses between program <strong>and</strong> control groups atmonth 54 (not shown) revealed no differences of note.This suggests that participation in learn$ave alone wasinsufficient to have any measurable impacts on futureorientation <strong>and</strong> likely means that individual discountrates, considered important determinants of financialbehaviour, were largely unchanged by the program duringthe 54-month period. It may well have been, since participantsself-selected for the project, that they already hadrelatively low discount rates <strong>and</strong> were forward-lookingenough to be interested in a project offering a generoussavings incentive for adult learning, an investment whosereturns are not immediate.Savings by household income levelThere is tentative evidence that the learn$ave matchedsavings credits alone <strong>and</strong> the credits plus services hadeffects that varied with income level at baseline. 4 Table 6.4shows that those with the very lowest incomes saw their3 These were taken from the future orientation questions in the Zimbardo Time PerspectiveInventory. See Zimbardo <strong>and</strong> Boyd (1999).4 It should be borne in mind that all learn$ave participants had, at most, 120 per cent of theLow-income Cut-off when they joined the study. In this context, “higher-income” participantshave only a modest income at enrolment <strong>and</strong> should not be interpreted as being well-off atthat time, just better-off relative to other participants.70 | Chapter 6 <strong>Social</strong> <strong>Research</strong> <strong>and</strong> <strong>Demonstration</strong> <strong>Corp</strong>oration

